

Trading skills
How to Backtest a Trading Strategy Without Fooling Yourself
Learn how to backtest a trading strategy step by step: write exact rules, include costs, avoid look-ahead bias and overfitting, and read results honestly.
Copy trading puts another person's decisions into your account. Here is how to look past a headline return before you trust anyone with your money.
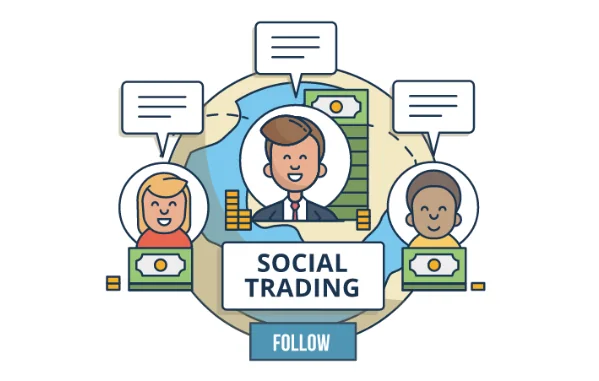
Copy trading repeats another trader's trades in your account. The risk is still yours.
means a platform automatically repeats another trader's decisions in your account, following rules you set up. Social trading is the wider idea: reading posts, sharing analysis or following ideas by hand. Neither one removes market risk.
First, find out what is being copied. It might be real shares. Or it might be (contracts for difference). With a CFD, you gain or lose the change in price without owning the asset, often with borrowed money. These come with different rights, costs and rules. A position called "gold" or "EUR/USD" on the screen does not tell you which one you hold. Read the account agreement before you look at anyone's returns.
Rules also depend on where you live. In the UK, the FCA explains when automatic copy trading counts as portfolio management, which means managing money for someone else. That is UK guidance. It does not mean a platform may offer the same service in the US, Canada or Australia. For the basics, start with social trading for beginners.
Many traders make a big gain one month and lose most of it the next. A steady record with small falls usually tells you more than one amazing month.
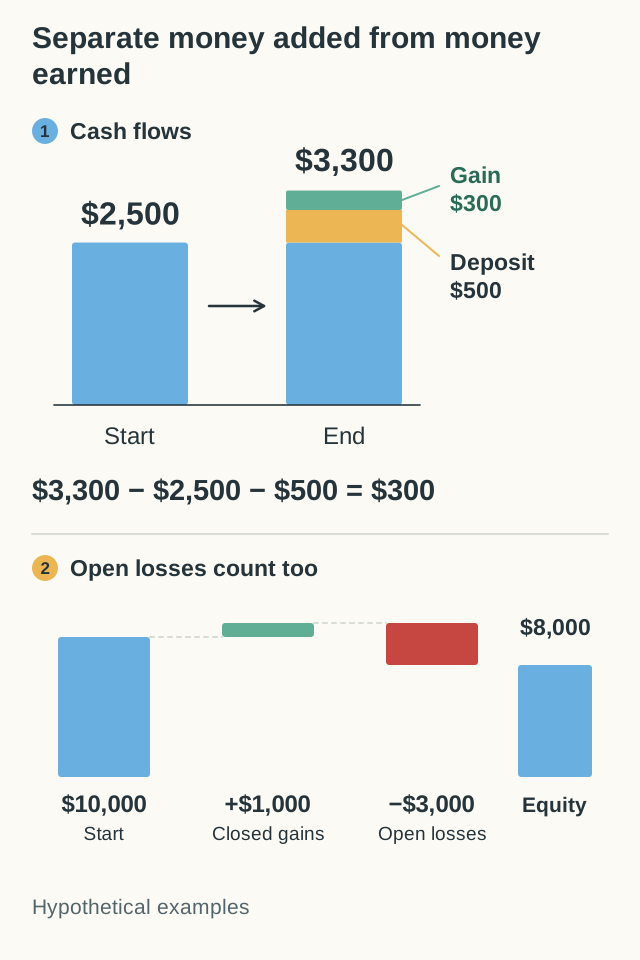
Also check how the return is counted. The often counts only closed trades. also counts the trades that are still open. A trader who keeps closing small winners, while leaving a big loser open, can show a great list of profits while the account sinks.
| What to check | Why it matters |
|---|---|
| Equity, including open trades | Shows losses hidden by leaving trades open |
| Deposits and withdrawals | Separates cash moved in or out from real returns |
| Maximum | Shows the biggest past fall from a high |
| Leverage and position size | Shows how much risk was taken with the money |
| Fees and financing | Shows the result after costs |
Try it yourself
Pick the trader you would copy, looking only at the 12-month return. Then press See the full story to turn the cards over.
Trader A (fictional) shows +84% in 12 months, but fell 46% from a high along the way and has only 13 months of history. Trader D shows +14%, with a worst fall of 7% over 52 months.
What would you expect?
What this shows: The biggest return came with the deepest fall. After Trader A's 46% drop, anyone who copied at the peak needed an 85% gain to get back.
A 12-month return shows only the end of the story. The worst fall, the risk score and the months of history show how deep the falls were, and how much evidence there really is.
Yes. Say a strategy makes 9 gains of $20 and 1 loss of $300. It wins 90% of the time, but it loses $120 overall, before costs.
Some traders also raise their stake after each loss, to win it back quickly. That can make a record look smooth for months, until a long losing run arrives. Ask what happens when the market keeps moving against the strategy.
A short record tells you little. Smooth returns in a calm market do not show what happens when trouble comes. Think of a sudden price gap, a surprise central bank decision, or a day when it is hard to sell. A past drawdown, a fall from a previous high, describes that sample only. It is not a limit on future losses.
Not exactly. The trader's order may fill before yours. Minimum trade sizes, rounding, currency conversion, a different start date and positions you already hold can all change what you end up with. Copying a percentage does not give every account the same prices or the same leverage.
Ask two questions before you start. Does copying open the trader's existing positions at today's prices? And when you stop copying, are your positions closed, left open, or is it your choice? A button that says "stop" may end the copying, not your trades. Test the controls in a practice account if the platform offers one.
Not always. means spreading your money across different risks. But three traders might all make the same bet. They might all buy the US dollar through different currency pairs. They might hold the same technology shares, or use the same risky method.
Say you put $6,000 into copy trading and split it equally between three traders, $2,000 each. If all three use their share to buy the same currency pair, you have one bet, not three. Splitting the money changed who places the orders, not the direction of your risk.
Group positions by what really drives them, not by profile pictures. Our lesson on how to read currency pairs shows how two pairs can hide the same bet on one currency.
Find out who gets paid when you follow, copy or subscribe. A trader who is paid for attracting copiers may want different things from you. Add up subscription fees, spreads, commissions, overnight financing and any share of profits. "No copy fee" does not mean "no cost".
Then check the company. In Canada, start with CIRO's dealer information and the national registration search it links to. In Australia, check the firm's licence and its product disclosure statement. In the UK, use the FCA register. In the US, first find out whether the service involves shares, futures or forex, then use the right regulator's register. Our guide to checking a broker shows how.
No kind of trading is free of risk. Copy trading adds its own risks: the trader can change style, your results can differ from theirs, and fees add up. Never copy with money you cannot afford to lose.
Look past the return. Check the full history, the worst fall (drawdown), open losses, leverage, how long they have traded and what you will pay. A record you can understand is worth more than an amazing one.
It depends on the platform. Some close the copied positions, some leave them open and some let you choose. Find out before you start, and test the controls in a practice account if you can.
Learn how to backtest a trading strategy step by step: write exact rules, include costs, avoid look-ahead bias and overfitting, and read results honestly.

Bill Lipschutz, George Soros, Druckenmiller, Kovner and Tudor Jones: how the best forex traders in the world made their money, and what the stories leave out.