


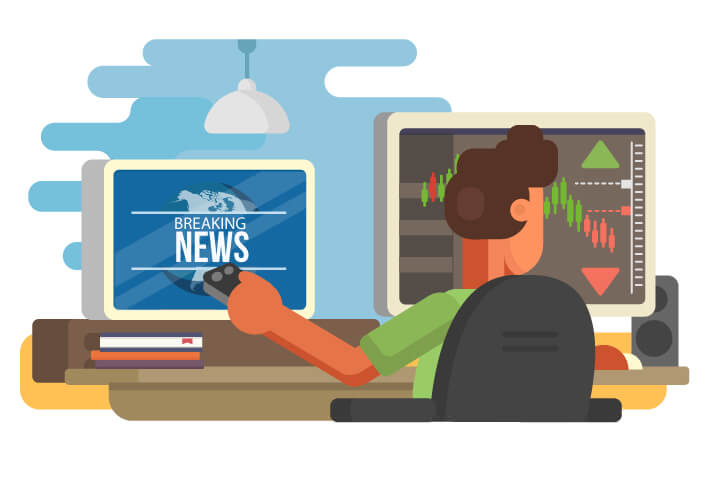
 New traders are often overwhelmed by the volume of information available through various Forex market analysis. Your ability to make decisions will depend on the overall understanding how markets work and if you can spot the trading opportunities before they are outdated.
- Fundamental Analysis – involves using political, economic, and social factors to assess a currency.
- Technical Analysis – involves studying currency charts in order to recognize patterns and exploit them.
One is not better than the other, and you’ll be an effective trader if you understand both. Just remember, there is a fundamental reason behind the evolution of a technical chart, where fundamental analysis concerns long-term trends, while technical analysis looks for patterns in the short-term behavior of a security. For example, you may use an interest rate change by a central bank (fundamental) to determine that you should go long on a currency pair, and then use a moving average (technical indicator) to determine the best price to enter the trade.
Fundamental Analysis

Fundamental analysis is a method that considers the economic strength of a nation. This strength is influenced by political, economic, and social forces, as well as monetary policy. Interest rates, Unemployment figures and Inflation reports are the top 3 fundamental factors to watch closely.
If the outlook is positive, then the country is more likely to attract investors. This investment results in increased demand for the currency of that nation as foreign currency needs to be converted to local currency to pay for the investments. This leads to a fundamental rule – The higher the demand for a currency, the higher its value will be.
For a small trader, it may be hard to think that supply and demand apply to currency. When more people want Japanese yen, its value increases to the highest bidder – the person willing to pay the most to have those yen in her account. Always remember that whenever you buy currency, someone else is selling it.
Technical Analysis

Technical analysts and traders look to past price movements in order to identify patterns. They believe that future price movements will follow the behavior of previous patterns. The theory behind this is that history and reactions to events tend to repeat again and again. Know the history and profit from it every time it repeats itself. There are many patterns that have been identified, but a common resistance pattern is shown below.
Support And Resistance
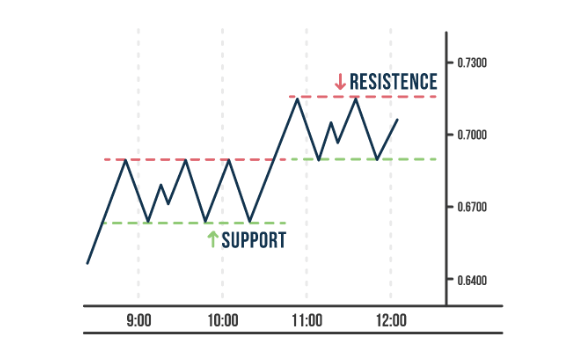
When the price reaches a certain level, it often tends to reverse as the opposite force (buying or selling) gets stronger and stops the initial movement. Once the other force takes overhand, the price reverses and traders who have followed previous reversals, can use them to profit again and again.
Reversals Tend To Occur On Round Numbers
Because market participants are humans, there is an interesting tendency for major turning points to occur around round numbers. This is due to the psychological tendency of humans to prefer round numbers rather than “messier” decimals. Retail traders also tend to place orders closer to whole numbers. This occurs whether it’s an entry, a stop-loss order, or a take-profit target. Because thousands of traders repeat this behavior, high volumes are often exchanged near whole numbers. That means that prices often hover around these support and resistance levels for longer periods as the backlog of higher orders is cleared. Knowing small secrets like this can help you make better decisions as a trader.
The Golden Rule Of Economic Indicators
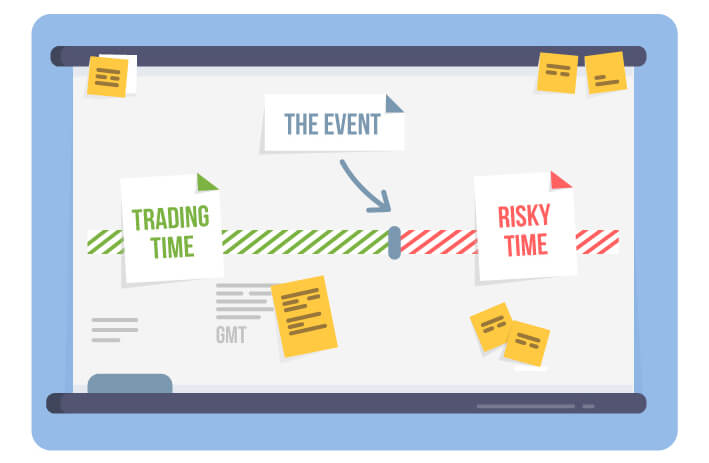
Developed nations regularly publish economic figures. Every nation publishes the release dates in advance, and you should plan for them. This is crucial because currency rates will often move even before the information is released.
Markets move on expectations and also on the forecasts that are contained in reports.
- If actual results > forecasts = good for the currency
- If actual results < forecasts = bad for the currency
For example, if a forecast predicts economic growth, then the market may rise before the report is released. If the actual data outperforms expectations, then the currency will rise even more. But, if growth is lower than expected, then the currency will lose value because it had already increased in expectation of growth.
1. Use An Economic Calendar
Be methodical and have a well-researched well-researched economic calendar that includes release dates for major reports. By being prepared for economic events, you will avoid losses and identify profitable times to trade.
2. Monitor Key Indicators
Make sure you are well informed about relevant economic indicators and understand how they are related. For example, if the British pound (GBP) is weak, it may be due to inflation, unemployment, political fears about Brexit, or a combination of all three. If the U.S. economy is growing, then traders will be watching Federal Reserve officials like hawks for indications about timing or interest rate changes.
3. Analyze The Forecasts
Forecasts are important. These are the “goalposts” that the market expects key indicators to fall within. When the actual results differ, that’s the best opportunity to make a profit. Don’t be caught unprepared for the event.
[wp_quiz id=”473″]