The majority of options will expire in periods between 30 seconds and 12 hours. There are also longer term options of 7 days or more. The biggest difference is in the level of predictability that you will experience. The shorter the time frame, the more likely it is you are just guessing. The longer the expiry time, the more likely it is you are going to be able to make a logical forecast.
Predicting which way a price will move within a short time frame like 30 – 60 seconds is near impossible. This is more akin to gambling on “red or black” at a casino. However, if you believe you have a information advantage, these situations can also be profitable.
Add News Event To Your Strategy
How does a 60% – 90% chance of getting your prediction right sound? It’s possible. For example, last year, it was well known the British referendum about European Union membership would occur mid year. Currency traders who thought about this event were able to place trades that predicted that the British Pound would fall in the lead up to the vote, as markets dislike uncertainty. By applying simple logic to a news event, traders were able to greatly increase their chances of making a profit.
Technical Strategies
When expiry times are extended beyond a few minutes, technical analysis becomes very useful. Technical analysis allows you to predict future price movements based on how prices behaved in the past.
Recognize a Trend
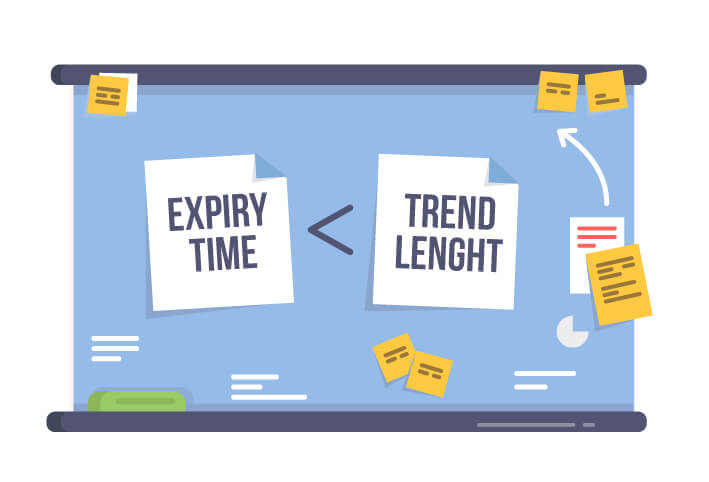
To confirm a trend, it is advisable to use a candlestick chart. It is also a good idea to use a longer chart time frame than your expiry time, as this will let you forecast with more accuracy. Chart time frames of 1 hour or more are best suited to this purpose. However, extreme short term traders may use candlestick charts that are as short as 1 minute – 15 minutes. 1 minute charts are best used for entry and exit signals. 15 minute charts are best used to check, trend, support and resistance levels, and to confirm these patterns. If you are trading options with 15 or 30 minute expiry times, then 1 and 4 hour candlestick charts should be used to check your forecasts.
So just remember, the rule of thumb is to use a chart that is a longer time frame than your option expiry time!
A longer term option is one that:
Making a options trade with an expiry time of 60 seconds is likely to get you odds of:
You can increase your odds of success by:
Share your Results:
