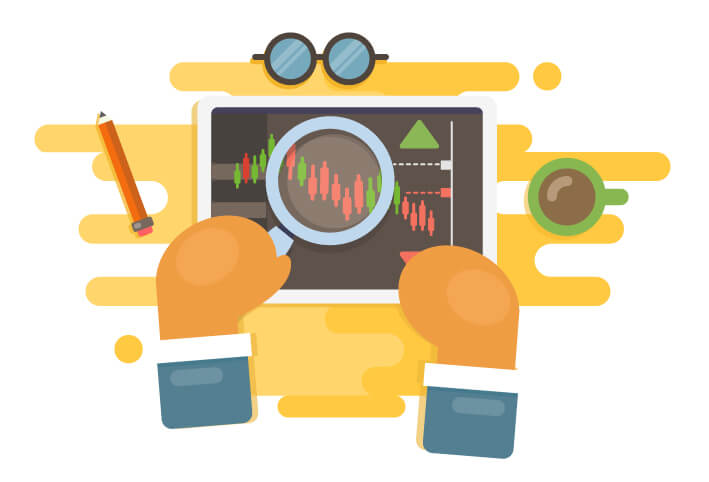
When you are looking for a broker, look for one that offers the ability to toggle to candlestick charts within the main trading interface. Dual screens such as two computer monitors or a computer monitor and a tablet computer (or even your phone) can also help you set up a optimized workspace.
If you look further than just the basics, you will find some more complex candlestick patterns.
- Doji – a doji occurs when the closing price and the opening price are the same.
- Long legged doji – after a series of smaller candlesticks, a long legged doji may indicate a change in a trend that is about to occur.
- Four price doji – this occurs rarely, and happens when the low price and the high price are the same as one another.
Being able to read a candlestick chart is part of the analytical framework of:
Share your Results:
