


Ever wish you could take a brilliant trading idea for a spin in a financial time machine? That's exactly what backtesting is. It lets you see how your strategy would have performed using old market data, giving you a sneak peek into its potential without risking a single dollar.
Think of it as the ultimate "try before you buy" for your trading plans. You can quickly find out if you're sitting on a potential goldmine or just a cool idea that doesn't work, all before you hit the "trade" button.
Your Time Machine for Smarter Trading
Before you put real money on the line, you get to see if your concept was a moneymaker or a total bust in the past.
It's basically a flight simulator for traders. You get to practice, "crash," and learn from your mistakes without any of the real-world financial pain. This isn't some secret trick only Wall Street pros use; it's a key skill for anyone who's serious about trading smarter.
Why Practice Before You Play
Imagine LeBron James heading into the NBA Finals without ever watching old game tapes. That would be crazy, right? Teams study past performances to find what works, what doesn't, and how to avoid making the same mistakes twice. For a trader, backtesting is your game tape.
It helps you get real answers to the tough questions:
- Does this idea actually work? This is how you go from a gut feeling to having data that backs you up.
- What’s the real risk here? You get to see the biggest potential drops in your account (called drawdowns) that your strategy might have faced.
- Can it handle different market moods? See how it performs when the market is booming, crashing, or just going sideways.
A Reality Check From the Pros
This isn't just theory; it's what the best in the business do. Ray Dalio, the billionaire founder of the world's largest hedge fund, Bridgewater Associates, built his entire empire on testing ideas against history. It's standard practice on any professional trading desk.
Believe it or not, the investment bank Goldman Sachs once fired a programmer who stole their secret "black box" trading code. That code was so valuable because it was built on years and years of historical data and backtesting. This stuff is the real deal.
But here's a crucial fact: backtesting isn't a magic eight ball. As some trading strategy findings show, only about 20-30% of backtested strategies stay profitable in live markets. This shows you how easy it is to accidentally build a strategy that only looks good in the past.
"The biggest mistake investors make is to believe that what happened in the recent past is likely to persist. They assume that something that was a good investment in the recent past is still a good investment." – Ray Dalio
That quote is a powerful reminder. Backtesting is an amazing tool for understanding your odds and risks, but it is not a crystal ball that predicts the future.
To help keep these core ideas straight, I've put together a quick reference table. Think of it as your cheat sheet for getting this process right.
Your Backtesting Cheat Sheet
Here’s a quick summary of what really matters in backtesting and the common traps to avoid.
| Key Component | Why It Matters | Common Mistake to Avoid |
|---|---|---|
| High-Quality Data | Garbage in, garbage out. Bad data gives you bad, misleading results. | Using free, messy data that has gaps, errors, or survivor bias. |
| Realistic Assumptions | Your simulation has to include real-world costs like fees, slippage, and taxes. | Forgetting about trading costs, which can turn a "winning" strategy into a loser. |
| Sufficient Time Period | The strategy needs to be tested in all market types (up, down, sideways). | Testing only on a recent bull market and thinking the results will last forever. |
| Out-of-Sample Testing | This checks if the strategy works on data it wasn't "trained" on. | Building a strategy that fits your historical data perfectly, making it useless in the real world. |
| Honest Performance Metrics | Look beyond just profit. Check drawdown, Sharpe ratio, and risk-adjusted returns. | Focusing only on the total profit while ignoring the scary drops your account took to get there. |
Keep these points in mind as you work through your own strategies. Avoiding these common mistakes is half the battle.
Gearing Up: Your Backtesting Toolkit
You wouldn't show up to a drag race with a bicycle. The same idea applies here. To test your trading strategy, you need two key things: historical data (your fuel) and backtesting software (your engine).
Let's get you set up with the right gear.
Finding Quality Fuel: The Importance of Good Data
First things first, let's talk about data. This isn't just a boring spreadsheet of old prices; it's the foundation of your entire test.
I've seen it happen too many times: a trader gets excited about a new strategy, grabs the first dataset they can find, and gets amazing results… only to lose money when they trade for real. Why? Because the data was junk. Bad data leads to bad results, giving you a totally false sense of confidence.
Think of it like building a LEGO model of a Ferrari. You need the official, precise blueprints. If you just guess, you'll end up with something that looks more like a blocky mess.
Where to Source Your Historical Data
So, where do you find these "blueprints"? You have options, and they don't all cost a fortune.
- Free Starting Points: For anyone just starting out, sites like Yahoo Finance are great. They offer years of free daily price data for stocks and major indexes. It's more than enough to get you going without spending any cash.
- Your Broker's Data: Most trading brokers give you historical data directly through their platforms. The quality is usually better than public sources and is often included with your account. It's also the same data you'll be trading on, so it makes sense to test with it.
- Professional-Grade Data: Once you get serious, you might want to look at paid data providers. These services are the gold standard. They offer super clean data that's been adjusted for things like stock splits and dividends-details that can totally mess up a backtest if they're ignored.
A trader I know spent months perfecting a strategy on free data, only to find out it failed miserably once he included dividend adjustments. He learned a tough lesson: investing a little in quality data upfront can save you a lot of money and frustration later.
Choosing Your Engine: The Right Backtesting Software
With your data ready, you need an "engine" to run your simulations. The great news is you don't need to be a coding genius to do this. Many modern platforms are surprisingly easy to use.
For visual traders, a platform like TradingView is a game-changer. It has powerful, built-in backtesting tools that let you apply a strategy right on a chart and watch the fake trades pop up in real-time.
Here’s a peek at what that looks like. This is TradingView’s strategy tester showing exactly how a simple moving average crossover strategy would have played out.
This kind of instant visual feedback is priceless. You can see the equity curve (your account balance over time), profit factor, and a full list of trades, making it easy to understand what worked and what didn't.
A Look at Your Options
Choosing the right platform can feel overwhelming, so I've put together a quick comparison to help you find the best fit.
Backtesting Platforms for Every Trader
| Platform | Best For | Ease of Use | Cost |
|---|---|---|---|
| TradingView | Visual chart-based testing and sharing ideas. | Very High | Freemium (Free, with paid tiers for more features) |
| MetaTrader 4/5 | Forex and CFD traders using automated bots. | Medium | Free (with a brokerage account) |
| Backtrader (Python) | Coders who want total control and customization. | Low (Requires Python) | Free (Open-source) |
| TradeStation | Traders wanting brokerage and advanced tools in one. | Medium-High | Varies (Platform fees may apply) |
No single platform is "the best"-it's all about what works for you. If you're a visual learner, start with TradingView. If you love to code, dive into Python with Backtrader.
For the more adventurous types, building your own backtester from scratch in a language like Python offers the ultimate freedom. Using tools like Pandas for data and Matplotlib for charts, you can create a testing environment perfectly suited to your needs. It’s a bigger challenge, for sure, but the payoff is total control over your simulation.
Building and Running Your First Test
Alright, let's get our hands dirty. This is where your trading idea stops being a hunch and starts becoming something you can actually prove-or disprove. We're going to walk through setting up your first backtest with a simple, classic strategy so you can see all the moving parts in action.
The single most important part? Defining your rules with zero wiggle room. A computer can't understand "buy when it looks good." You have to be super specific. As the famous trader Jesse Livermore said, "The game of speculation is the most uniformly fascinating game in the world. But it is not a game for the stupid, the mentally lazy, the person of inferior emotional balance, or the get-rich-quick adventurer." His point is that you need discipline and rules.
Defining Your Strategy Rules
Before you run a simulation, you need a non-negotiable "playbook" for your strategy. This takes emotion and guesswork out of the picture. Your computer is just going to follow the instructions you give it, no questions asked.
To build this playbook, you have to answer a few key questions with 100% clarity:
- Entry Signal: What exact event makes you buy? A classic example is, "Buy when the 50-day moving average crosses above the 200-day moving average." It’s a specific, measurable event.
- Exit Signal (Profit): When do you take your profits? This could be a fixed target, like a 10% gain, or when a technical indicator flips.
- Stop-Loss Signal (Loss): At what point do you admit you were wrong and cut your losses? A common rule is to sell if the price drops 2-3% below your entry point.
- Position Sizing: How much of your account are you willing to risk on one trade? A professional standard is risking no more than 1-2% of your total capital on any single idea.
Getting these rules on paper is the first real step toward a useful test. If you need some inspiration, you can check out some of the top 3 trading strategies that traders often use as a starting point.
Setting Up the Simulation
Once your rules are set in stone, it’s time to plug them into your platform. This means setting up the environment for your test by defining a few key parameters.
This flow chart gives a great overview of the data pipeline you need before you even start testing.
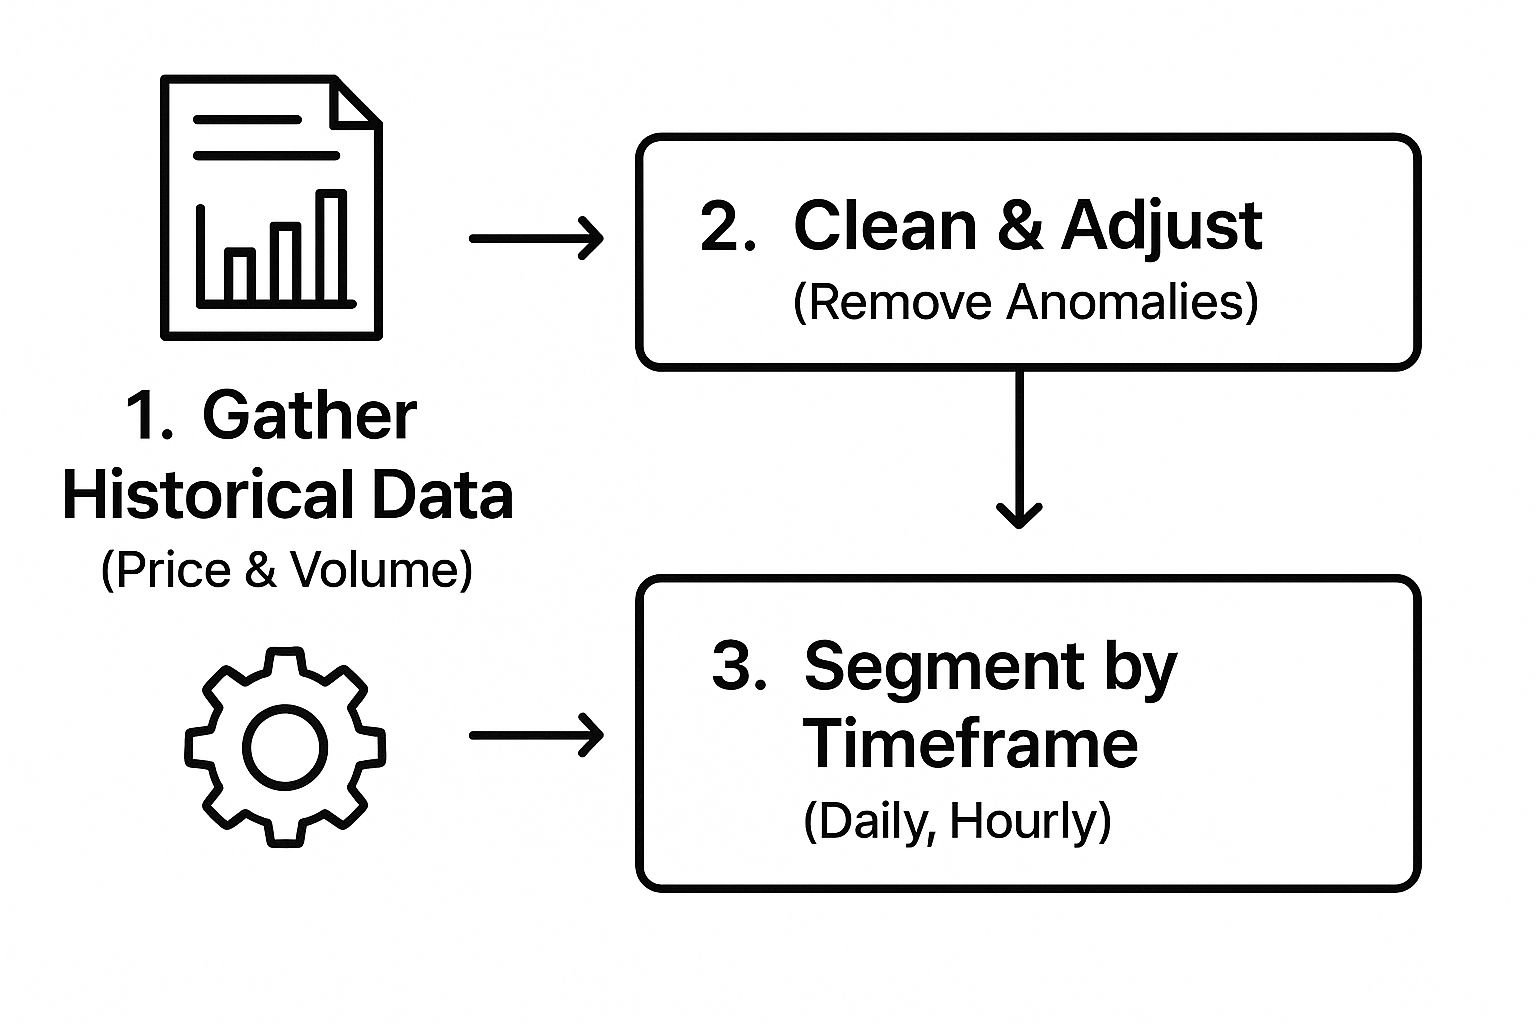
As you can see, it all starts with raw data that has to be cleaned and organized. Skipping this step is a sure way to get results you can't trust.
Now, let's lock in the test conditions:
- Date Range: You need a long enough timeline to see how your strategy handles different market storms-bull markets, bear markets, and boring sideways action. I always recommend at least 10 years of data if you can get it.
- Starting Capital: Pick a realistic number. Let’s say $10,000.
- Transaction Costs: This is a big one. You have to include fees (commissions) and slippage (the tiny price difference between when you click buy and when your order actually fills). A reasonable estimate might be $1 per trade for commissions and 0.05% for slippage. Ignoring these costs is a classic rookie mistake.
With your rules defined and parameters locked in, you’re finally ready to hit 'run'.
That moment when you watch your strategy execute thousands of trades over a decade of history is an amazing learning experience. It's the first real clue you'll get into whether your idea has potential or if it's back to the drawing board.
How to Read Your Backtest Results
Okay, you’ve run your test. Now you're staring at a screen full of numbers, charts, and weird terms. Don't worry. This part is less about complex math and more about being a detective, looking for clues about your strategy's true personality.
It's so easy to just look at the final profit number and get excited. But a strategy that made a million dollars while almost wiping out your account five times is a ticking time bomb. You have to look deeper.
Let's break down the essential clues to look for.
Beyond the Bottom Line
The first thing everyone sees is Net Profit. This is the total money your strategy made or lost over the test, after all costs. It's the headline number, but it never tells the whole story.
A huge profit is great, but how bumpy was the ride? Imagine two roads to the same city. One is a smooth highway, and the other is a dangerous mountain pass with huge cliffs. You’d probably prefer the highway, right? That’s what we need to figure out for your strategy.
The Metrics That Really Matter
To understand the journey, not just the destination, you have to look at a few key numbers. These reveal the true risk and consistency of your strategy.
- Maximum Drawdown: This is the scariest-but most important-number. It measures the single biggest drop your account took from its highest point. A 50% drawdown means that at one point, your account was worth half of what it used to be. Could you mentally handle watching half your money disappear? Be honest.
- Win Rate: This is simply the percentage of trades that made money. While a high win rate feels good, it can be very misleading. A strategy that wins 90% of the time but has one giant loss that wipes out all the wins is a terrible strategy.
- Sharpe Ratio: This one sounds complicated, but the idea is simple: It measures how much return you got for the amount of risk you took. A higher Sharpe Ratio (usually, you want to see it above 1.0) suggests you're getting more bang for your buck, risk-wise. For context, Warren Buffett's Berkshire Hathaway has historically had a Sharpe Ratio way above the market average, proving that consistent, risk-adjusted returns are the key to long-term success.
Think of it this way: Net Profit is your final score in a video game. Maximum Drawdown is the most health you lost in a single boss fight. A high score is meaningless if you barely survived.
To get a better handle on interpreting performance, you need to be comfortable with charts. If you're trading currencies, understanding how to read forex charts is a key skill that will help you visualize these metrics. You can learn more about how to read forex charts in our detailed guide.
Putting It All Together
Let's look at a real-world example. You've tested two strategies. Here are the results.
| Metric | Strategy A | Strategy B |
|---|---|---|
| Net Profit | +$20,000 | +$15,000 |
| Max Drawdown | 45% | 15% |
| Win Rate | 70% | 55% |
| Sharpe Ratio | 0.8 | 1.5 |
At first glance, Strategy A looks better with a higher profit and win rate. But that 45% drawdown is a huge red flag. It’s a stomach-churning drop that most people can't handle.
Strategy B, while less profitable on paper, was a much smoother ride with a higher Sharpe Ratio and a manageable drawdown. Any professional trader would choose Strategy B every single time because it’s more sustainable and won't give you a heart attack.
Analyzing your results is about figuring out if your strategy is a hidden gem or just fool's gold. It’s how you learn to see beyond the surface and truly understand the risks.
Common Backtesting Traps to Avoid
https://www.youtube.com/embed/4opqvUAeLYg
Alright, let's talk about the part that could save you a ton of money and frustration. It’s a classic story: someone builds a strategy that looks amazing in a backtest, only to watch it fail the second real money is involved.
So, why does this happen? It's usually because of a few common mental traps that create a false sense of security.
These traps are sneaky. They can make a bad strategy look like a masterpiece, convincing you that you've found a secret money-making machine. In reality, you’ve just found a mistake in your testing process. Learning to spot these is just as important as reading your results.
The Curve-Fitting Catastrophe
The biggest and most dangerous trap is overfitting, also called curve-fitting. This is what happens when you tweak your strategy so perfectly to your historical data that it can't adapt to new, live market conditions.
Think of it like this: imagine you get an exact copy of last year's final exam. You could memorize every answer and get a perfect 100%. But what happens when you find out this year's exam has totally different questions? You’d fail, because you only memorized old answers instead of actually learning the material.
Overfitting is the trading version of that. You've taught your strategy to memorize the past, not to understand how the market works.
To avoid this:
- Keep it simple. The more rules and filters you add, the higher your risk of overfitting. As Leonardo da Vinci said, "Simplicity is the ultimate sophistication." Simpler strategies are often stronger.
- Test on "unseen" data. Always keep a chunk of data that your strategy has never seen before (this is called out-of-sample data). If your strategy does great on the data you built it on but fails on the new data, you've probably overfitted.
Sneaky Biases That Lie to You
Besides overfitting, a few other biases can sneak in and ruin your results. They're like using a crooked ruler to measure something-the numbers look fine, but they're fundamentally wrong.
One of the most common is survivorship bias. This happens when your historical data only includes companies that are still around today. For example, you might test a strategy on the current S&P 500 stocks going back 20 years. The problem? You're ignoring all the companies that went bankrupt or got bought out, like Blockbuster or Enron. Your results will look way better than they should because you only tested on the "survivors."
Then there's lookahead bias. This is when your test accidentally uses information that you wouldn't have known at the time of the trade. A simple example would be using the day's closing price to trigger a buy order that morning. In the real world, you can't know the future.
As the old saying goes, "Hindsight is always 20/20." Lookahead bias is like giving your past self a copy of today's newspaper. It's cheating, even if it's an accident, and it will make your strategy seem way more powerful than it actually is.
Stress-testing your strategy is all about being a skeptic. Question everything. Assume your results are wrong until you can prove they're right by hunting down and getting rid of these common biases. A truly strong strategy isn't the one that looks perfect on paper-it's the one that survives this kind of tough questioning.
Got Questions About Backtesting? You're Not Alone.
Getting into backtesting can feel like peeling an onion-every time you think you've got it, another layer appears. It's totally normal to have a few questions.
Let's clear up some of the most common ones so you can get back to testing with confidence.
So, How Much Historical Data Is Enough?
There’s no single, perfect answer here, but my rule of thumb is to use more than you think you need. For a stock trading strategy, I wouldn't even bother looking at it without at least 10-15 years of solid historical data.
Why so much? Because markets have different moods and cycles.
You absolutely have to see how your strategy would have survived different environments:
- Raging Bull Markets: Those easy-money times when it feels like every stock is going up.
- Nasty Bear Markets: The painful crashes that can wipe people out.
- Directionless Sideways Markets: The frustrating, choppy periods where nothing seems to happen.
If your strategy only looks good during a five-year bull run, you don't have a strong strategy-you have a lucky one. Testing across a decade or more is the only way to see if your idea can actually handle a real storm.
Should I Bet the Farm Based on My Backtest Results?
Let me be super clear on this one: absolutely not. Please, don't ever make that mistake. A backtest is a powerful tool, but it's a simulation of the past, not a prediction of the future.
Think of it as a dress rehearsal for a play. It’s essential for finding problems and building confidence, but it’s not the live performance.
There's a great saying often attributed to Mark Twain: "History doesn't repeat itself, but it often rhymes." A backtest helps you find those potential rhymes-the patterns that tend to show up again. It doesn't give you a script for what's going to happen tomorrow.
A great backtest is a huge green light, but it’s the green light to move on to the next stage: paper trading. It is never a signal to risk your real money. It just means your idea has earned the right to face the real, unpredictable market.
What's the Real Difference Between Backtesting and Paper Trading?
This is a fantastic question because they serve two different, but equally important, purposes. They’re both about practice, but they test completely different skills.
One is about speed and data; the other is about patience and psychology.
| Type of Testing | What It's For | The Big Advantage |
|---|---|---|
| Backtesting | Running your strategy against past data to see how it would have done. | It's incredibly fast. You can test a decade's worth of trades in minutes. |
| Paper Trading | Using your strategy in the live market right now, but with fake money. | It tests your execution and emotions in real-time, unpredictable conditions. |
The workflow used by serious traders is a logical progression. You backtest the concept to see if it even works on paper. If it does, you paper trade it to see how it feels in the wild. Only after it passes both of those tests should you even think about trading it with a small amount of real money.
Ready to put this knowledge into action? At Agfin Ltd, our Finance Illustrated platform offers a free, interactive Forex course and risk-free simulators like Trading Game to help you build real skills without the risk. Start your journey and learn to trade smarter.