

Trading skills
AI Trading Claims: How to Check a Bot or Signal Before You Trust It
Learn to test AI trading bot claims: what '90% accurate' can hide, why a great backtest can be luck, and how to check the company behind the offer.
A backtest shows how a set of rules would have done on old prices. Learn to run one honestly, and why a brilliant past result can still be luck.

means applying a fixed set of trading rules to old prices, and working out what those rules would have done. It is like a flight simulator for a trading idea: you can crash without losing money.
A backtest can show you weak ideas, maths mistakes and hopes that were too high. It cannot prove that a strategy will make money in the future. The trades never really happened, so nobody paid real prices or felt real pressure.
Take it one step at a time. First, backtest the idea on old prices. Next, it on live prices with virtual money (see what paper trading is). Only then think about real money, if at all.
You can backtest by hand, by moving through an old chart one candle at a time without peeking ahead. Many charting platforms have a built-in strategy tester. Our free investing tools guide compares a few. People who write code often use free Python tools such as Backtrader.
Imagine you test 20 rules on the same old prices. Even if none of them has a real edge, one will come out on top by chance. Its results will look amazing. If you then trade only that one, you are betting on luck.
The same thing happens when you keep changing one rule until the results look great. This is called . It is like getting a copy of last year's exam and remembering every answer. You score 100%, then fail this year's exam, because the questions are new.
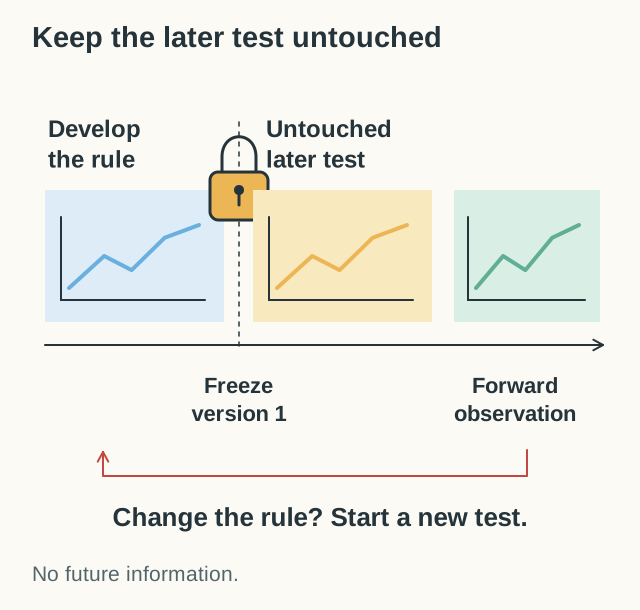
The fix is simple but strict. Build your rule on an earlier period of prices. Then test it once on a later period you have not looked at, called . If you change the rule after seeing that result, the later period is no longer a fair test.
Also write down every version you tried, not just the winner. And check nearby settings. If a 20-day rule works but 19-day and 21-day rules fail, be very careful.
Try it yourself
Press Generate 20 strategies and look at the best result. Then press Run it on new data and see how the past winner does.
Each of the 20 made-up strategies wins 50% of its trades and risks 1% each time, so none has a real edge. After 100 trades, one still looks best. On new data, its chance of winning each trade is still 50%, the same as all the others.
What would you expect?
What this shows: All 20 strategies here are coin flips. The best past result came from luck, so it tells you nothing about the next 100 trades.
That is why you keep some data aside. A strategy has to do well on data you did not use to pick it before its results mean anything.
"Buy when the trend looks strong" cannot be tested. Two people would read it in two different ways. A testable rule is exact. Here is a made-up example, not a recommendation:
Then add the rest of the rules. When do you exit? How big is each trade? How many trades can be open at once? What about overnight financing costs, and days with missing prices? Also, the "previous 20 days" must not include today.
Give the rule a version number. When you change it, keep the first version, so you can always see what you started with.
means your test uses information you could not have known at the time. A classic mistake: the rule checks today's closing price, then records a buy at today's opening price. At the open, the close did not exist yet. Fix the timing before you trust any result.
A similar problem: if your stop and your target both sit inside one candle, the candle does not show which one came first. Use more detailed data, or assume the worse outcome.
Your data must also fit the question. Daily midpoint prices cannot show exact bid and ask fills for a one-minute strategy. For forex, you need bid and ask prices, financing costs and weekend gaps. For shares, include splits, dividends and companies that disappeared.
If you test only on companies that exist today, you skip the ones that failed, such as Enron, which collapsed in 2001. This is called , and it makes results look better than they really were.
If your data has both bid and ask prices, buy at the ask and sell at the bid. The spread is then already in your results, so do not subtract it again. Add commission, financing and currency conversion on top. See how the spread works in forex.
If you only have midpoint prices, add an estimated spread and : the gap between the price you expected and the price you got. Label these as guesses, and test what happens when they are bigger.
| Item | Result |
|---|---|
| 4 winning trades at $20 each | +$80 |
| 6 losing trades at $10 each | −$60 |
| Result before costs | +$20 |
| Costs of $3 for each of the 10 trades | −$30 |
| Result after costs | −$10 |
Winning 4 trades in 10, with wins twice the size of losses, sounds good. Here, costs turn a $20 gain into a $10 loss. No win rate or ratio is good on its own. It depends on all the other numbers.
Do not stop at the final profit. Note the dates tested, the number of trades, the result after costs and the largest fall, called the .
A drawdown is a fall from a previous high. If a test account falls from $10,000 to $8,000, that is a 20% drawdown, and it needs a 25% gain to get back. A past drawdown is not a limit on future losses.
A high win rate can hide a few very large losses. So stress your test: raise the costs, make the fills worse, skip a few trades and look at the worst periods on their own. No single number of years suits every test. Match the test to how often the rule trades and to the conditions it needs.
The US regulator CFTC warns that made-up trading results can leave out spreads, fees and real-world problems. If your idea survives all this, follow the frozen rules forward with virtual money and record each trade in a paper trading journal. A good backtest is never, on its own, a reason to deposit money.
There is no single minimum. A rule that trades a few times a year needs many years of data to collect enough trades. Try to include rising, falling and sideways markets, and keep a later period aside for testing.
A backtest runs your rules on old prices, quickly. Paper trading runs them on live prices with virtual money, in real time. Paper trading also tests whether you can follow your own rules.
Yes. You can test by hand: move through an old chart one candle at a time, without peeking ahead, and record each trade in a spreadsheet. Many charting platforms also have a built-in strategy tester.
Learn to test AI trading bot claims: what '90% accurate' can hide, why a great backtest can be luck, and how to check the company behind the offer.

Meet five famous currency and macro traders: Lipschutz, Soros, Kovner, Druckenmiller and Tudor Jones. Learn what their stories show, and what they hide.