Ever wondered if people like George Soros, the guy who famously made a billion dollars in one day betting against the British Pound, were just built different? Fun fact: Soros's fund, the Quantum Fund, returned an average of over 30% per year for more than two decades – a record that even beats Warren Buffett's. But here's the secret: every trading legend started with the basics. This guide breaks down 8 simple forex trading strategies for beginners, using simple language even a high-schooler can get. Forget the confusing jargon. We're giving you actionable blueprints to understand the world's biggest money market.
Inside, you'll find clear, step-by-step instructions for each strategy. We'll show you real-world chart examples, outline the pros and cons, and help you decide which approach fits your style. Before you can execute these plans, it’s essential to choose from the many reliable trading platforms available to start your journey on the right foot.
The goal here isn't to make you a billionaire overnight. It's to give you a solid foundation and a practical toolkit of strategies you can begin testing immediately, maybe in a risk-free demo account. Ready to turn those confusing charts into clear opportunities? Let's dive in.
1. Trend Following Strategy
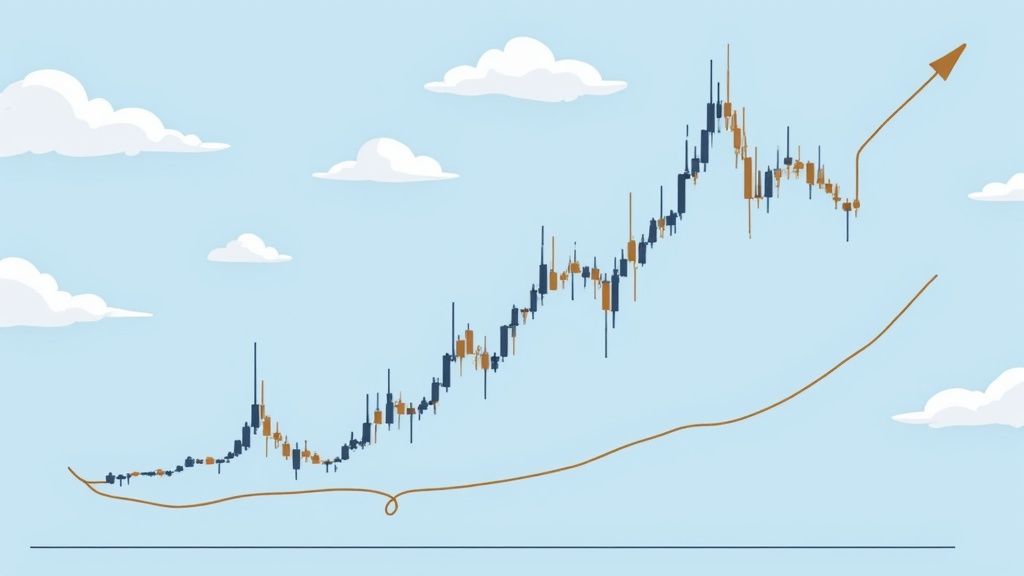
Imagine you're at a huge concert and the crowd starts moving toward the main stage. The easiest thing to do is just go with the flow, right? That’s the core idea behind the trend-following strategy, one of the most classic and effective forex trading strategies for beginners. Instead of trying to guess when the market will turn, you just find a clear direction – an "uptrend" (prices are climbing) or a "downtrend" (prices are falling) – and ride the wave.
As the legendary trader Jesse Livermore said, "The trend is your friend." This strategy operates on a simple, powerful principle: an object in motion tends to stay in motion. You're not trying to be a hero who catches the exact bottom or top; you're just joining a party that's already in full swing.
How It Works in Practice
To spot a trend, traders use tools called technical indicators, most commonly moving averages (MAs). Think of these as smoothed-out lines on your chart that show the average price over a certain period.
- Spotting an Uptrend: A popular signal is when a shorter-term MA (like the 50-day) crosses above a longer-term MA (like the 200-day). This is famously called a "golden cross" and is often seen as a strong buy signal.
- Spotting a Downtrend: The opposite is a "death cross," where the 50-day MA crosses below the 200-day MA, signaling a potential time to sell.
For example, if you see the EUR/USD chart showing a golden cross on the 4-hour timeframe, a trend follower would enter a buy position. They would then hold this position, using a stop-loss set below a recent low point to manage risk, and only get out when the trend shows clear signs of weakening.
Actionable Tips for Trend Following:
- Patience is Your Superpower: Don't jump in at the first sign of a move. Wait for the trend to be confirmed by your indicators.
- Use Multiple Timeframes: Think of it like zooming in and out on a map. Check the trend on a daily chart to confirm what you see on a 4-hour chart. A trend that exists across multiple timeframes is much stronger.
- Set Your Stop-Loss Smartly: In an uptrend, place your stop-loss just below a recent low (a "support" level). This gives your trade room to breathe without getting knocked out by normal market noise.
- Know When to Take Profit: Your exit signal could be when the moving averages cross back over or when the price breaks a key trendline. Don't let a winning trade turn into a losing one by being greedy.
2. Support and Resistance Strategy
Imagine bouncing a basketball. The floor stops the ball from falling further – that's "support". Now, imagine you throw it up to the ceiling. The ceiling stops it from going higher – that's "resistance". The Support and Resistance strategy uses this exact idea for forex trading, making it a perfect starting point for beginners. You find price levels where the market has historically bounced off and use them as trading zones.
This strategy is built on the idea of market psychology: price levels that were important in the past are likely to be important in the future. Instead of chasing a fast-moving price, you are patiently waiting for the price to come to a pre-planned "zone of interest" where you can act with more confidence. It's like setting a trap instead of chasing your prey.
How It Works in Practice
First, you need to find these levels. Look at a chart and draw horizontal lines where the market has reversed multiple times. The peaks ("swing highs") form resistance, and the valleys ("swing lows") form support.
- Trading a Bounce: When the price of a currency pair, like EUR/USD, drops to a strong support level (e.g., 1.0800) and shows signs of bouncing up (like forming certain candlestick patterns), a trader might buy. Their target for taking profit would be the next resistance level.
- Trading a Rejection: On the flip side, if the price rises to a known resistance level and stalls, traders look to sell, expecting a drop back down towards support.
For example, if the USD/JPY pair repeatedly fails to break above the 150.00 level, a trader using this strategy would place a sell order near that price, setting a stop-loss just above it to protect against an unexpected breakout.
Actionable Tips for Support and Resistance:
- Think in Zones, Not Lines: Think of support and resistance as areas or zones, not exact price lines. The market rarely respects a perfect number. It's more like a bouncy castle floor than a hard line.
- Higher Timeframes Are King: Levels you find on daily or weekly charts are way more significant and reliable than those on a 15-minute chart.
- Look for Confirmation: Don't trade just because the price touches a level. Wait for a confirmation signal, like a specific candlestick pattern (like a "pin bar"), to show that other traders are also seeing and reacting to that level.
- Old Support Becomes New Resistance: When a strong support level is finally broken, it often turns into a new resistance level, and vice-versa. This is a super powerful concept to watch for.
3. Breakout Strategy
Imagine a soda can being shaken up, building pressure before it explodes. That's the idea behind the breakout strategy, a popular choice among forex trading strategies for beginners. This approach involves watching a currency pair that's trading sideways in a tight range, like a coiled spring, and then jumping into a trade right as it "breaks out" of that box.
The goal is to catch the very beginning of a new, powerful move. Markets don't trend forever; they often pause and chill out. A breakout signals that the indecision is over and a new directional move is starting. You aren't just joining a trend; you're trying to be one of the first people on the ride as a new trend begins.
How It Works in Practice
Breakout traders first find key levels of support (a price floor) and resistance (a price ceiling) that have trapped the price. These levels form a "box" or a channel. A breakout happens when the price finally and powerfully moves above the resistance or below the support.
- Bullish Breakout (Buy Signal): The price breaks above a key resistance level. Traders would look to enter a long (buy) position, expecting the price will keep climbing.
- Bearish Breakout (Sell Signal): The price breaks below a key support level. This signals a chance to enter a short (sell) position, expecting the price to fall further.
For instance, if GBP/USD has been stuck between 1.2500 and 1.2550 for a few days, a breakout trader would be on high alert. If the price powerfully shoots up to 1.2560, they would see that as a buy signal, betting a new uptrend is starting. They would place a stop-loss just inside the old range, maybe at 1.2545, to protect against a "fake-out."
Actionable Tips for Breakout Trading:
- Volume is Your Friend: A real breakout often comes with a big spike in trading volume. If the price moves out of the range but volume is low, it might be a fake signal.
- Wait for the Retest: A classic pro move is to wait for the price to break out and then come back to "retest" the old support or resistance level. If it bounces off this level and continues, it confirms the breakout is legit.
- Avoid Quiet Hours: Breakouts are less reliable during quiet market hours. Stick to high-volume times like the London-New York overlap for better signals. It's like trying to start a wave at an empty stadium – you need a crowd.
- Set Smart Stop-Losses: Place your stop-loss just on the other side of the breakout level. If the price falls back into the old range, your reason for entering the trade is gone, so it's time to get out.
4. Moving Average Crossover Strategy
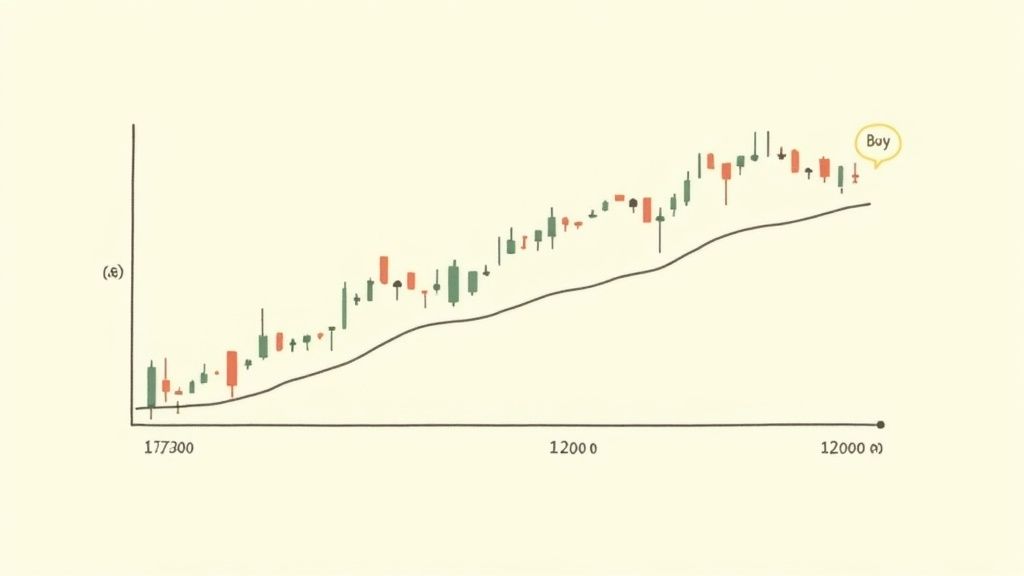
Think of moving averages as the GPS for your forex trades. A single line can tell you the general direction, but when you have two lines – a fast one and a slow one – crossing over each other, it’s like your GPS saying "Recalculating… new route found!" This is the moving average crossover, one of the most visual and simple forex trading strategies for beginners.
The strategy uses two moving averages with different time periods on your chart. A "buy" signal happens when the shorter-term, faster moving average crosses above the longer-term, slower one. A "sell" signal happens when the faster MA crosses below the slower one. The main idea is that these crossovers can signal a shift in the market's momentum.
How It Works in Practice
The most famous crossover combo is the 50-period and 200-period moving average. Traders watch these two lines like hawks on daily charts.
- Bullish Crossover (Golden Cross): When the 50-period MA (a measure of medium-term momentum) crosses above the 200-period MA (a measure of long-term momentum), it's seen as a strong sign that an uptrend might be starting. Traders would look to buy.
- Bearish Crossover (Death Cross): When the 50-period MA crosses below the 200-period MA, it suggests momentum is shifting down, and sellers might be taking control. This is a potential signal to sell.
For instance, if you were watching the GBP/JPY pair and saw its 20-period Simple Moving Average (SMA) cross below its 50-period SMA on the 1-hour chart, you could see this as a short-term sell signal.
Actionable Tips for Moving Average Crossovers:
- Use EMAs for More Speed: Use Exponential Moving Averages (EMAs) instead of Simple Moving Averages (SMAs) if you want signals that react more quickly to recent price changes. Think of it as the sports car version of the indicator.
- Confirm with Other Tools: Don't trade on a crossover alone. Use another indicator like the Relative Strength Index (RSI) to confirm if the market is overbought or oversold, adding more confidence to your trade.
- Match Timeframes to Your Style: Use longer-period MAs (like 50 and 200) on daily or 4-hour charts for longer-term trades. For day trading, use shorter periods (like 9 and 21) on 15-minute or 1-hour charts.
- Avoid Choppy Markets: This strategy works best in trending markets. Crossovers can give a lot of false signals in a sideways or "choppy" market, so check the overall market vibe first.
5. Price Action Strategy
Imagine you're trying to understand a conversation by focusing only on someone's body language, not their words. That’s the idea behind the price action strategy. Instead of using indicators like moving averages, this “naked” trading approach focuses purely on the price movement itself. You're reading the market’s story directly from the candlesticks on the chart.
The goal is to analyze price patterns to understand the market's mood and predict what might happen next. It's based on a powerful belief: all the important information about the market is already shown in its price. You are learning to read the raw language of the market. This is a core skill and one of the most respected forex trading strategies for beginners to learn.
How It Works in Practice
Price action traders look for specific candlestick patterns that show up at key support and resistance levels. These patterns give clues about whether buyers or sellers are in control.
- Spotting a Bearish Reversal: A classic signal is a "pin bar" at a resistance level. This candle has a long upper shadow, showing that buyers tried to push the price up, but sellers were stronger and pushed it right back down. This rejection is a strong hint the price might fall.
- Spotting a Bullish Reversal: An "engulfing pattern" at a support level is a powerful buy signal. This happens when a big bullish candle completely "swallows" the previous smaller bearish candle, showing a major shift in momentum from sellers to buyers.
For example, if you see a large bullish engulfing pattern form on the USD/JPY chart right at a daily support level, a price action trader would likely enter a buy order. They'd place their stop-loss just below the low of that pattern to manage risk.
Actionable Tips for Price Action Trading:
- Master a Few Key Patterns: Don't try to learn 50 patterns at once. Start by mastering 3-4 powerful ones, like the pin bar, engulfing pattern, and inside bar.
- Location, Location, Location: A candlestick pattern is way more powerful when it appears at a significant level, like a major support/resistance zone, a trendline, or another important chart area.
- Start on Higher Timeframes: Price action is clearer and more reliable on higher timeframes like the 4-hour or daily charts. This helps you avoid the "noise" of the super short-term charts.
- Keep a Journal: Take screenshots of your trades and write down which patterns worked and which didn't. This will dramatically speed up your learning and help you recognize the best setups.
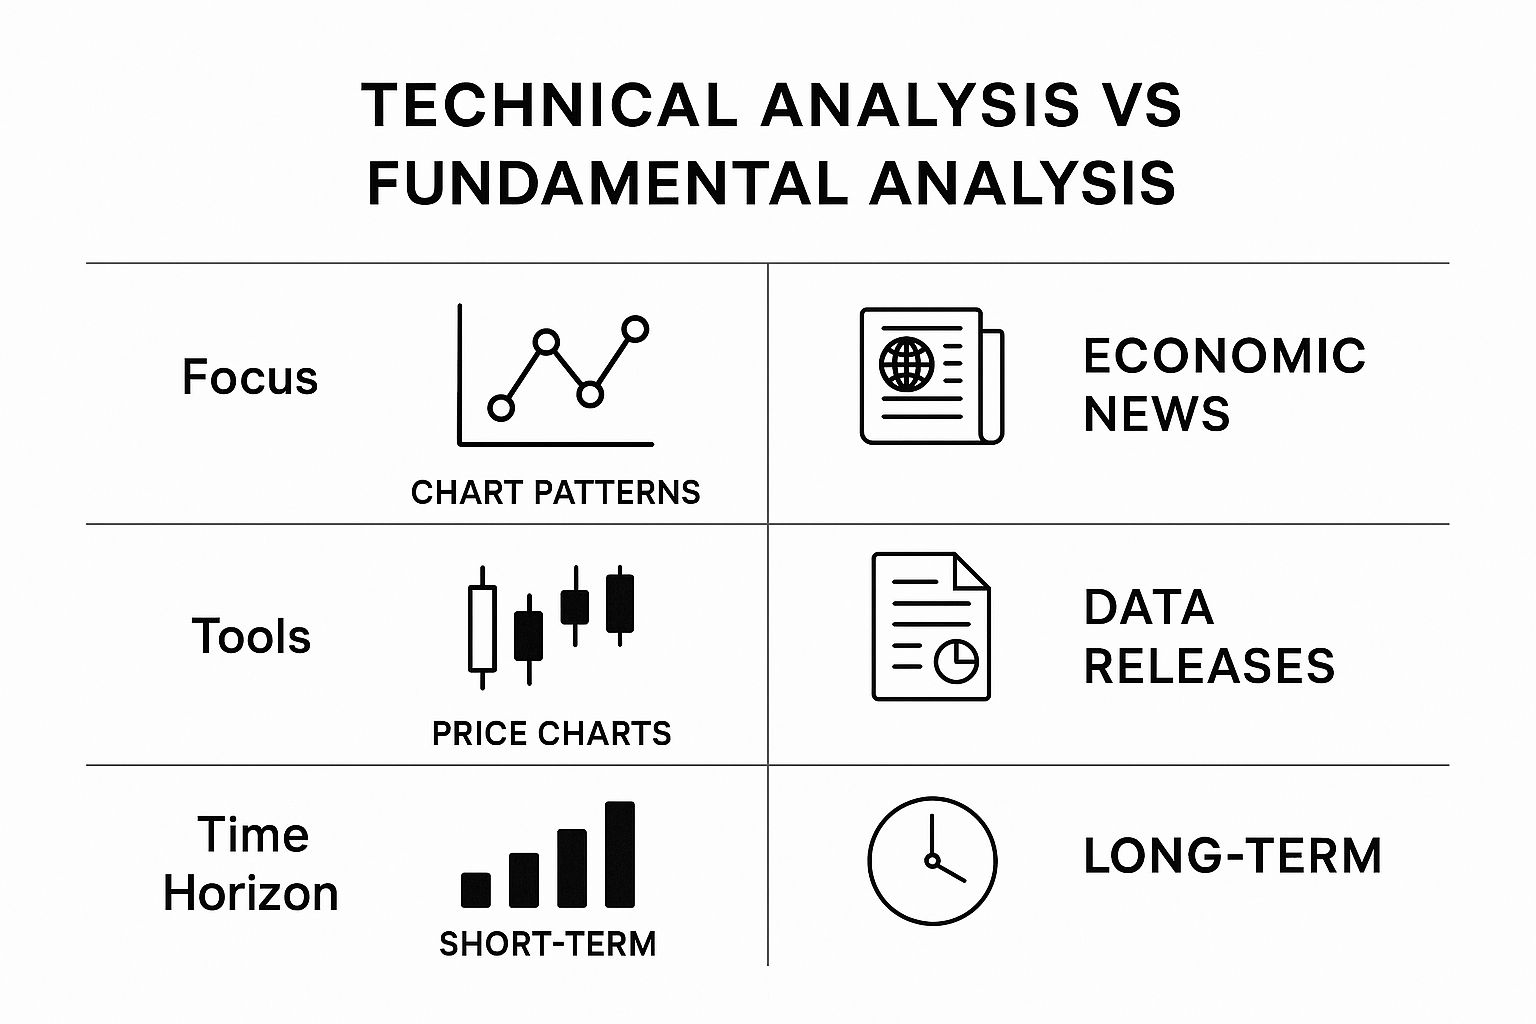
6. Economic Calendar Strategy
Imagine you're waiting for a major movie trailer to drop. You know the exact time it will be released, and you know the internet is going to go wild. Trading the economic calendar is similar. You're getting ready for the market's reaction to scheduled news events that act as major plot twists for a country's economy.
This strategy involves trading around big economic news, like unemployment numbers, interest rate decisions, or inflation reports. A fun fact: the US Non-Farm Payrolls report, released on the first Friday of every month, can sometimes move currency pairs by over 100 pips in a matter of minutes. Instead of just looking at charts, you're trading based on what drives the currencies themselves.
How It Works in Practice
Economic calendars (you can find them for free online) list upcoming news, what experts expect the numbers to be, and how much impact it could have-usually color-coded with red for high impact.
- Positive Surprise: If the real data is much better than expected (e.g., US unemployment drops more than predicted), the US dollar (USD) is likely to get stronger. A trader might buy a pair like USD/JPY.
- Negative Surprise: If the data is worse than expected (e.g., UK inflation is higher than the forecast), the British pound (GBP) might get weaker. A trader could look to sell a pair like GBP/USD.
For example, if the US Non-Farm Payroll (NFP) report shows 250,000 new jobs were added when the forecast was only 180,000, this huge positive surprise would likely trigger a strong buying wave for the USD. A trader could enter a buy position on USD/CHF moments after the news.
Actionable Tips for Trading the News:
- Focus on the Big Stuff: Only pay attention to the "red-flagged" events on the calendar. These are the ones that really move the market.
- It's All About the Surprise: The biggest moves happen when the actual number is very different from what everyone expected. If the numbers match the forecast, the reaction might be small.
- Let the Dust Settle: The first few minutes of a news release are extremely chaotic. It's often smarter to wait 5-15 minutes for a clearer direction to emerge.
- Use Tighter Stop-Losses: News trading is fast and can reverse direction quickly. Use a tighter-than-usual stop-loss to protect your money from sudden spikes.
- Know Your Stuff: To trade the news well, it helps to understand what influences exchange rates. This knowledge helps you know which data points matter most for each currency.
7. Risk-Reward Ratio Strategy
Imagine you're a pro baseball player. Would you swing at every single pitch? Nope. You'd wait for that perfect pitch in your sweet spot that gives you the best chance of hitting a home run. That's exactly how the risk-reward ratio strategy works. It’s less about being a psychic and more about being a smart manager of your money. This is probably the most important of all forex trading strategies for beginners.
This strategy is built on one simple rule: only take trades where the potential profit is way bigger than the potential loss. You're setting yourself up to win big and lose small. This means you don't even need to win every trade to be profitable. In fact, you can be wrong more often than you are right and still grow your account.
How It Works in Practice
The risk-reward ratio is a simple calculation. A common standard is 1:2, meaning for every $1 you risk, you aim to make at least $2 in profit. If a trade setup doesn't offer that, you just don't take it – you wait for a better pitch.
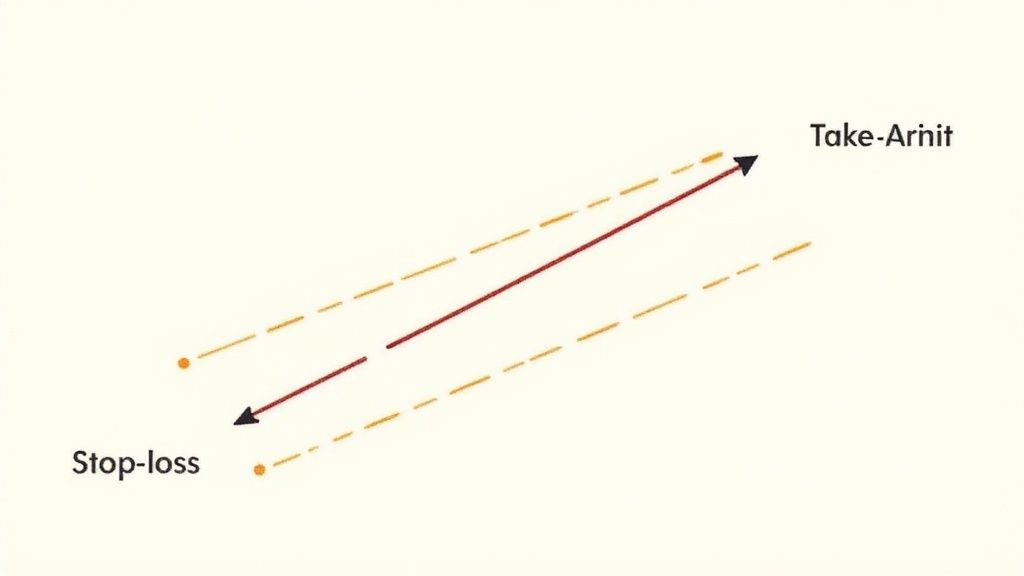
- Finding the Setup: Let's say you want to buy EUR/USD at 1.0750. You decide a good place for your stop-loss (your max loss) is at 1.0725, which is 25 pips away.
- Calculating the Reward: To get a 1:2 risk-reward ratio, your take-profit target needs to be at least 50 pips above your entry price (25 pips of risk x 2). This puts your target at 1.0800. If the chart suggests the price is unlikely to reach that level, you skip the trade.
By sticking to this rule, one winning trade will cancel out the losses of two losing trades, giving you a powerful mathematical edge for long-term success.
Actionable Tips for Risk-Reward:
- Risk a Tiny Percentage: Never risk more than 1-2% of your total trading account on a single trade. For a $1,000 account, that’s a maximum risk of $10-$20. This rule is what separates pros from gamblers.
- Calculate Your Position Size: Use a free online position size calculator. It will tell you exactly how large your trade should be based on your account size, risk percentage, and where your stop-loss is.
- Patience and Discipline Are Key: The hardest part is saying "no" to trades that don't meet your rules. Skipping a low-quality setup is a winning move in itself.
- Aim Higher When You Can: While 1:2 is a great starting point, always look for setups that offer a 1:3 ratio or even better. These are the "home run" trades that can really boost your account.
8. Bollinger Bands Strategy
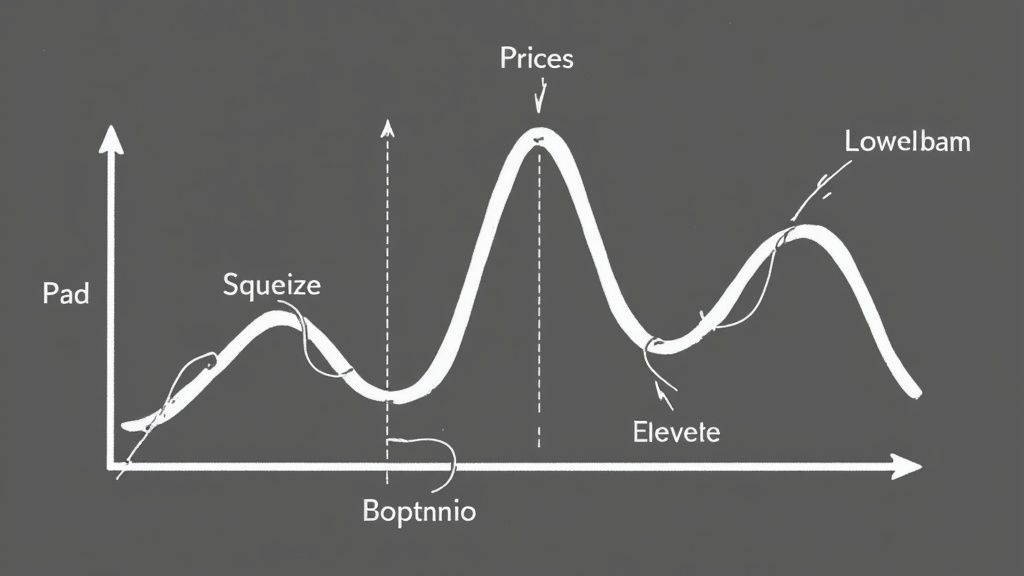
Imagine a river. When it's calm, its banks are close together. After heavy rain, the river swells, and the banks are far apart. Bollinger Bands work just like that for currency prices, showing you when the market is quiet versus when it's volatile and "swelling" with action. This makes them a fantastic tool for spotting when a price might be too high or too low.
Developed by famous analyst John Bollinger, this strategy uses three lines: a middle moving average, an upper band, and a lower band. The bands expand when the market is wild and contract when it's calm. The main idea is that prices tend to return to the middle, making the outer bands potential reversal points. This is one of the most visual forex trading strategies for beginners.
How It Works in Practice
The bands act like moving support and resistance levels. When the price touches the upper band, it’s considered possibly overbought, signaling a potential chance to sell. When the price touches the lower band, it’s considered possibly oversold, suggesting a buying opportunity might be close.
- Spotting a Sell Signal: A trader might see the GBP/USD price hit the upper Bollinger Band on a 1-hour chart. This could be a trigger to enter a sell position, betting on a pullback toward the middle band.
- Spotting a Buy Signal: If the price of EUR/AUD falls and bounces off the lower Bollinger Band, a trader might take this as a sign to enter a buy position, expecting a move back up.
A key pattern to watch for is the "Bollinger Squeeze." This is when the bands get very narrow, signaling low volatility. It's often the calm before the storm, hinting that a big price breakout is about to happen.
Actionable Tips for Bollinger Bands:
- Don't Use Bands Alone: Use another indicator like the Relative Strength Index (RSI) to confirm overbought or oversold conditions. A price hitting the upper band is a much stronger sell signal if the RSI is also above 70.
- Respect the Trend: In a strong uptrend, prices can "walk the band" by constantly touching the upper band without reversing. Don't try to sell in these situations; instead, use touches on the lower band as possible entry points to join the trend.
- Look for the Squeeze: When you see the bands getting super tight, get ready for a move. Wait for the price to break out powerfully above the upper band or below the lower band to enter a trade in the direction of the breakout.
- Confirm with Price Action: A touch of a band is good, but a touch combined with a reversal candlestick pattern (like a pin bar) is even better confirmation.
Beginner Forex Strategies: 8-Point Comparison
| Strategy | Complexity 🔄 | Resource Requirements ⚡ | Expected outcomes 📊 | Ideal use cases 💡 | Key advantages ⭐ |
|---|---|---|---|---|---|
| Trend Following Strategy | Moderate 🔄🔄 – rule-based with trend confirmation | Low–Moderate ⚡⚡ – charting tools, time to wait | Reliable in trending markets 📊 ⭐⭐⭐ – steady gains when trends persist | Swing/position trading; trending markets | Aligns with momentum; clear visual signals ⭐⭐⭐ |
| Support and Resistance Strategy | Low 🔄 – horizontal level identification | Low ⚡ – simple chart tools, little compute | Consistent for ranges 📊 ⭐⭐ – clear entries/exits but breakout risk | Swing trades, range-bound pairs, beginners | Objective levels; easy to learn and implement ⭐⭐⭐ |
| Breakout Strategy | Moderate–High 🔄🔄🔄 – needs filters and fast execution | Moderate–High ⚡⚡⚡ – alerts, rapid execution, risk controls | High variance, high reward potential 📊 ⭐⭐⭐ – many false breakouts | Volatile markets, news-driven moves, momentum plays | Captures strong directional moves early; high R:R potential ⭐⭐⭐ |
| Moving Average Crossover Strategy | Low 🔄 – simple crossover rules | Low ⚡ – basic indicators, easily automated | Works in trends but lagging 📊 ⭐⭐ – late entries possible | Beginners, automated systems, trend confirmation | Very simple and automatable; rule-based execution ⭐⭐ |
| Price Action Strategy | High 🔄🔄🔄 – subjective, requires experience | Low ⚡⚡ – minimal indicators but time-intensive study | High potential with skill 📊 ⭐⭐⭐ – fewer false signals when mastered | Discretionary traders, multi-timeframe analysis | Uses raw price (no lag); adaptable and intuitive ⭐⭐⭐ |
| Economic Calendar Strategy | Moderate 🔄🔄 – requires fundamental interpretation | Moderate ⚡⚡ – calendar feeds, prep time, event monitoring | Predictable windows but volatile outcomes 📊 ⭐⭐ | Event-driven trading, swing/position setups | Logical rationale for moves; teaches fundamentals ⭐⭐⭐ |
| Risk-Reward Ratio Strategy | Low 🔄 – rules for entry only when R:R acceptable | Low ⚡ – position-sizing tools, discipline | Improves long-term expectancy 📊 ⭐⭐⭐ – reduces drawdowns | All traders; risk management backbone | Protects capital; statistically sustainable approach ⭐⭐⭐ |
| Bollinger Bands Strategy | Low–Moderate 🔄🔄 – volatility-based interpretation | Low ⚡ – standard indicator, easy to plot | Effective in ranges and squeeze breakouts 📊 ⭐⭐⭐ | Ranging markets; breakout preparation | Visualizes volatility; supports mean-reversion and breakout setups ⭐⭐⭐ |
What's Next? Putting Your Strategy into Action
You've just walked through eight different forex trading strategies for beginners, from classic Trend Following to the explosive Breakout Strategy. Each one gives you a different way to look at the market. It can feel like a lot, but the goal isn't to master all eight overnight. The real mission is to find the one strategy that just clicks with you.
Think of it like learning to play a video game. You don't try to master every character at once. You pick one, learn their moves, and practice until you can execute combos without thinking. The same idea applies here. Which approach felt the most natural? Was it the clear rules of a Moving Average Crossover or the storytelling of Price Action?
Your Three-Step Action Plan
The journey from knowing these strategies to actually using them to make money is all about practice. Billionaire investor Warren Buffett famously said, "Risk comes from not knowing what you're doing." The best way to reduce that risk is through focused, hands-on experience. This is where you separate yourself from the 90% who give up.
Here are your next steps:
- Choose Your Fighter: Reread the list and pick just one strategy to start with. If you like clear rules, the Moving Average Crossover is a great fit. If you like reading the market's mood, Price Action could be your thing. Don't overthink it – just pick the one that makes the most sense to you right now.
- Enter the Sandbox (Demo Account): Before you even think about putting real money on the line, open a demo account. This is your personal training ground. Use it to place trades based on your chosen strategy, test different currencies, and get a feel for the platform without any financial pressure. The goal here isn't to make fake money; it's to build real skills and confidence.
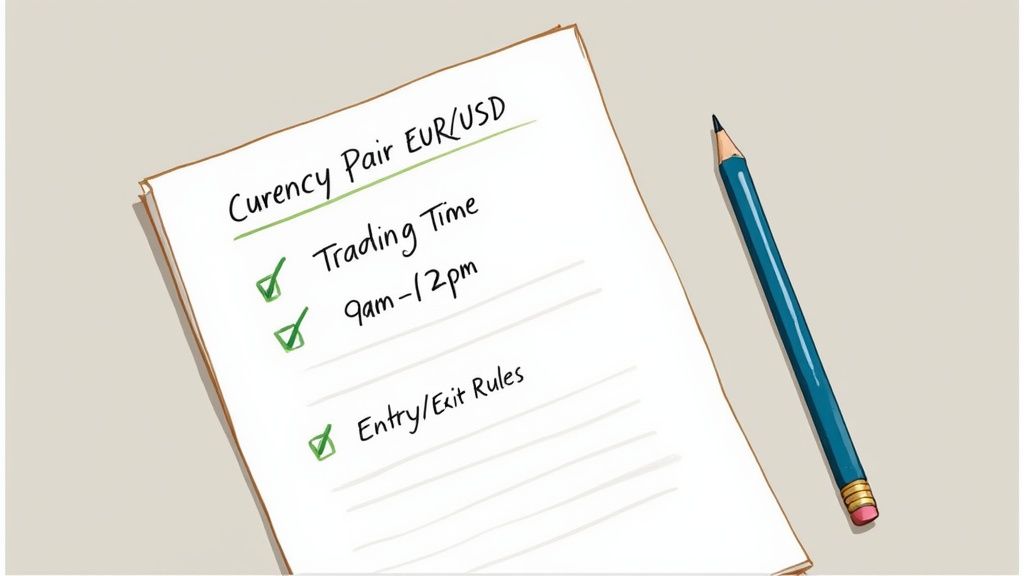
- Become a Trading Scientist: Start a trading journal from day one. For every trade you take (even the practice ones), log the why, what, and how. What was your entry signal? Why did you set your stop-loss there? What was the result? This journal will become your most valuable coach, showing you your strengths, weaknesses, and the patterns in your own decisions.
Mastering forex trading isn't a sprint; it's a marathon. The strategies we've covered – from Bollinger Bands to the simple Risk-Reward Ratio – are your starting tools. By picking one and dedicating yourself to practicing it, you're building the discipline that defines successful traders. Your journey doesn't begin with a huge deposit. It begins with a single, well-practiced strategy.
Ready to put theory into practice without the risk? financeillustrated.com offers powerful trading simulators and interactive learning tools designed to help you master these forex trading strategies for beginners in a hands-on environment. Start your no-risk training and build real skills today at financeillustrated.com.