A free tool is useful when it answers a real question. These ten cover planning, fee checks, company research, chart reading, records and virtual practice; you do not need to install them all.
We make the apps marked "Made by our team". Some links earn us a commission. This never decides a product's place in a list. How we choose and make money.
Jump to an option (10)
The full list
1. Investor.gov compound interest calculator
Best for: Planning how your saving could grow
A free calculator from the US SEC. Enter a starting amount, monthly saving, years and a return, plus a range above and below it.
Review a practice trade and compare it with your original reasoning
Watch out
Practice results are not real investment returns
Optional Pro features cost money; AI chart analysis is beta and can be wrong
Available in
Available in the US, Canada, UK and Australia. A learning app, not a real-money broker.
Costs
Free to start. Optional paid Pro plan.
Platforms
iPhone, Android, web
Account type
Educational simulation; does not offer real-money brokerage services.
Last checked
2026-10-21
Plan a savings scenario with Investor.gov, compare US fund costs with FINRA, and check the legal firm before funding an account.
Start with the question in front of you
If you are planning a first contribution, use the calculator. If you have two funds in mind, compare their fees. If you want to understand an order before buying, use Trading Game, our practice app. The list above gives each tool a distinct job and action.
A simple research sequence
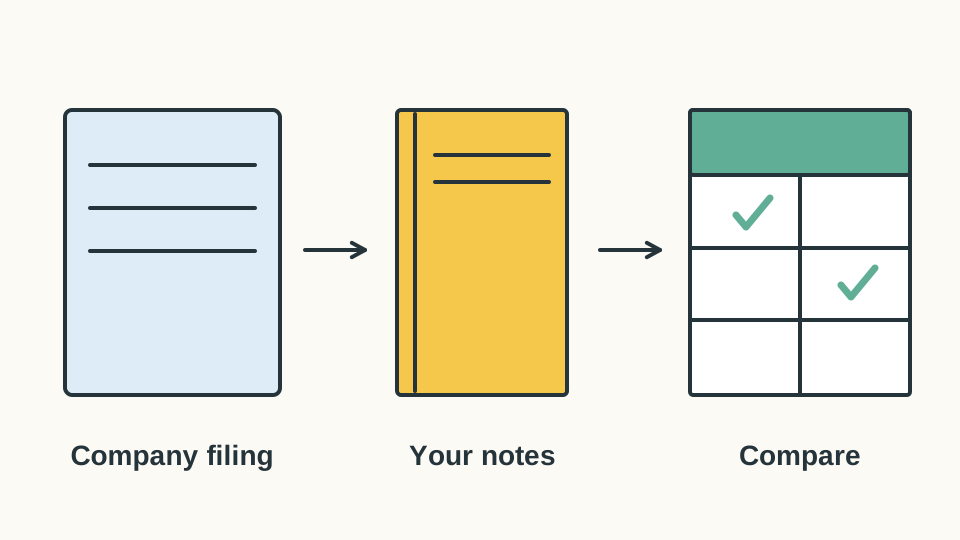
Suppose a familiar company appears in a . Open its EDGAR , check the reporting period and read how it earns money. Use a chart to inspect its price history, then record the idea and your reasons in a watchlist or spreadsheet. Each tool supplies a different piece; a matching filter or rising chart is not a purchase decision.
These are research and learning tools. To buy real shares, compare account providers in our beginner stock-app guide, including eToro's US stock service and Canadian alternatives.
Why should you check fees before anything else?
Funds charge a yearly fee called the . It comes out of your money every year, whether the fund goes up or down. Small numbers add up over time.
FINRA Fund Analyzer lets you compare up to 3 US funds. It shows how fees, expenses and discounts change what you keep over time. FINRA is the body that oversees US brokers. Our lesson on ETFs and mutual funds explains where fund fees come from.
The same thinking applies to paid tools. A $20 monthly subscription costs $240 a year. On a $2,000 portfolio, that's 12% of your money. That's a high bar for any tool to beat.
Try it yourself
Race two funds
Press Race, then change the fees and race again.
This assumes a steady 6% yearly return before fees, compounded monthly after the fee, with no deposits and no tax. $10,000 then becomes about $58,454 after 30 years at a 0.1% fee, against $44,677 at a 1% fee. The illustrative difference is about $13,777; real returns vary.
What would you expect?
What this shows: Under this example's constant-return assumptions, the higher annual fee leaves about $13,777 less after 30 years.
Fees reduce the amount left to compound. Compare the two fee inputs while keeping the investment, return and time assumptions the same.
How do you research a company for free?
Start with what the company itself reports. In the US, SEC EDGAR gives free access to company filings, such as the yearly 10-K and the quarterly 10-Q. In Canada, public companies file on SEDAR+.
A filing tells you what happened. It is not advice to buy. Check the company's legal name, the period and the units before you copy a number. Sales "in millions" are very different from sales "in thousands".
Example.
Company A's sales grow from $100 million to $120 million, up 20%. Company B grows from $50 million to $65 million, up 30%. B looks better. But A's cash from its business rose from $12 million to $14 million, while B's fell from $4 million to minus $2 million. Now you have better questions to ask.
Finviz helps you find companies to research. You set filters, such as company size or sector, and it lists matching US stocks. Its free version shows quotes about 1 minute late.
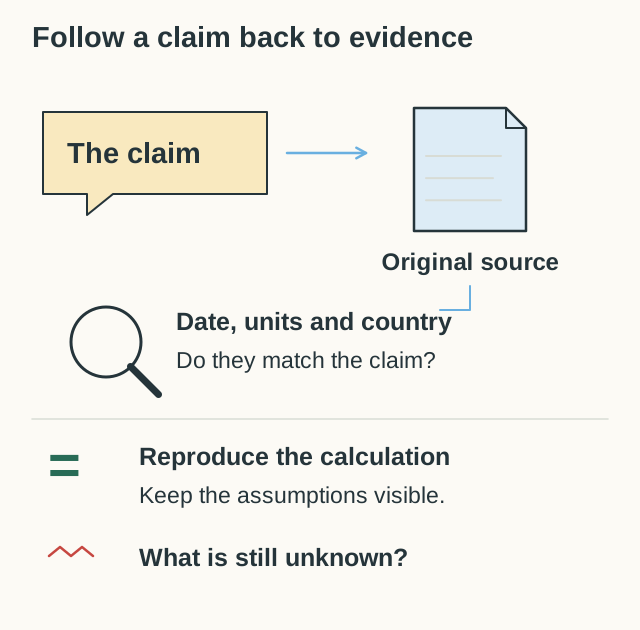
Trace a tool’s company number back to the original filing, period and units. Reproducing the sum helps you spot comparisons that use different definitions.
How do you use an investing calculator?
Investor.gov's calculator, run by the US SEC, asks for 4 things. You enter your starting amount, how much you add each month, how many years and an estimated yearly return. You can also add a range above and below your return.
Use that range. The return is a guess, not a promise. Here is $1,000 after one year, before costs and tax:
At 5%: $1,050.
At 0%: $1,000.
At minus 10%: $900.
Change one input at a time. If you change the return and the monthly amount together, you can't tell which one made the difference. Save your inputs next to each result so you can compare them later.
Australian readers can use Moneysmart's compound interest calculator, from the regulator ASIC. The maths is the same in any currency.
Track deposits separately from investment gains
Yahoo Finance separates Watchlists from Portfolios: a Watchlist follows possible investments; a Portfolio records holdings. Some brokerage links are available, or you can enter holdings yourself.
Google Sheets gives you more control over the calculation. Record units, purchase costs, deposits, withdrawals and dividends. The GOOGLEFINANCE function can supply some prices, but Google says quotes may be up to 20 minutes late and are not for trading.
If your balance rises from $1,000 to $1,500 after a $500 deposit, that change alone is not a 50% return. Separate contributed cash from investment growth. For Canadian and US holdings, choose one reporting currency and record the exchange rate and date.
Use virtual practice to examine a decision
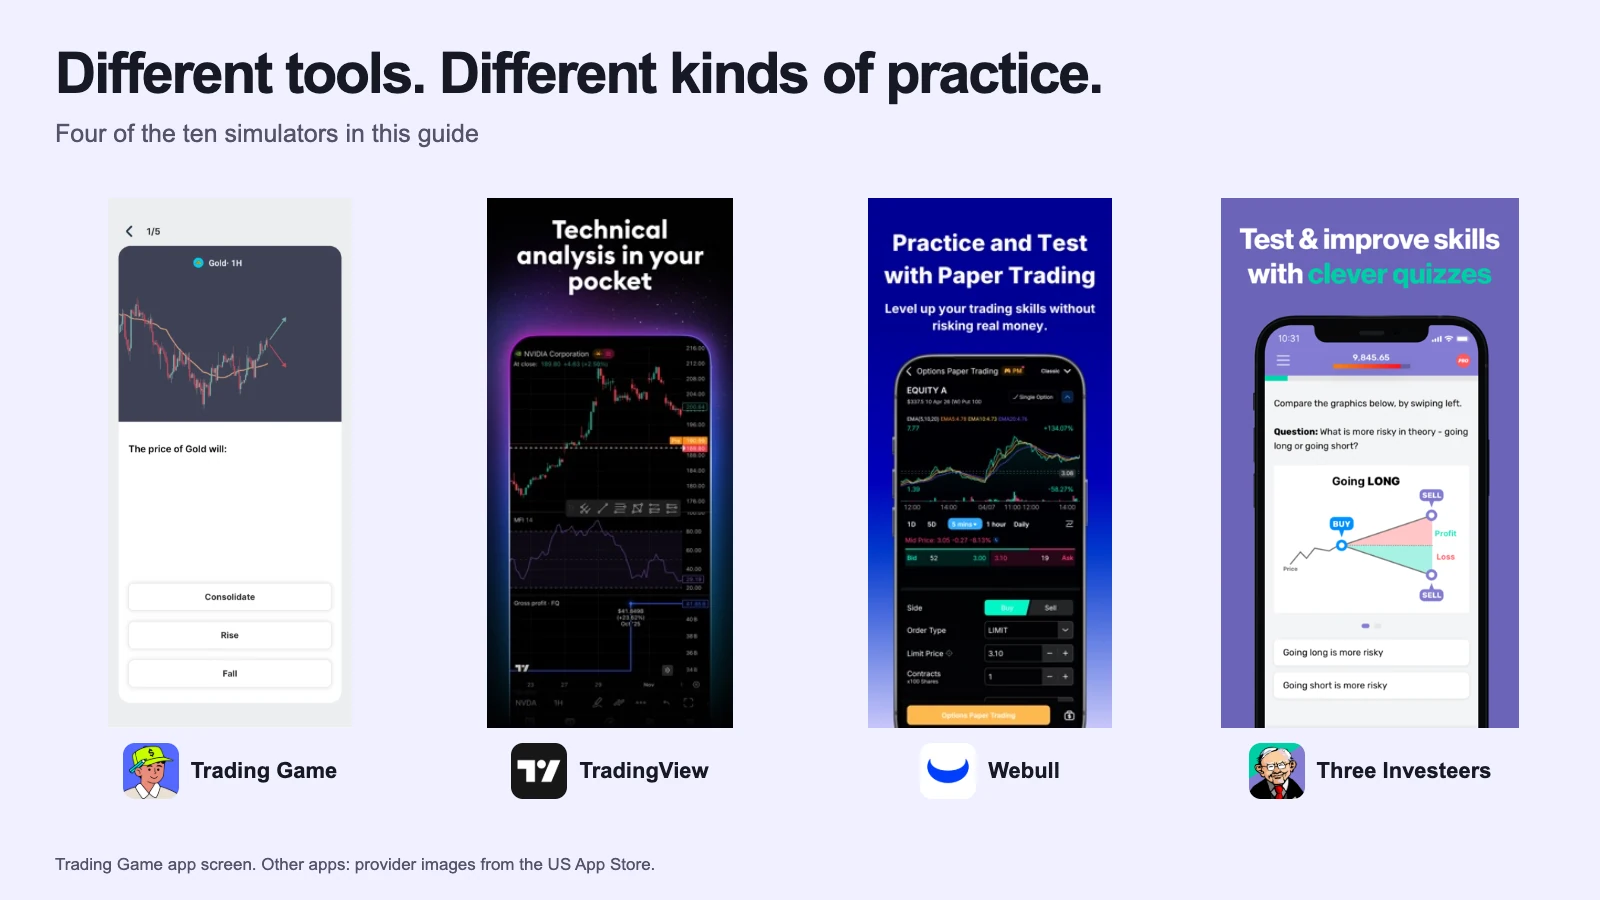
Trading Game, made by our team, combines lessons with virtual trades and is available in the US, Canada, the UK and Australia. A useful exercise is to write down why you expect a price to move, place a small practice position, and revisit the explanation after the price changes.
Its AI chart analysis draws levels and explains a reading of the chart. The provider labels it beta and says it can be wrong. Write your own interpretation first, then compare the assumptions and timeframe. Our guide to checking AI trading claims helps you question the output.
A virtual result shows what happened to that practice position. It does not establish what a real order would fill at or how you would handle losing savings.
How we chose
Each tool answers a different task: planning, checking a firm, comparing fund costs, reading filings, screening, charts, records or practice. This is a toolkit, not a ranking of investment returns.
We checked the official descriptions on 21 October 2026. We do not accept payment for placement. We did not connect brokerage accounts or test every feature. We make Trading Game; its position does not imply better investment outcomes. Paid upgrades are optional and should earn their place through a feature you actually need.
Questions beginners ask
What is the best free investing tool for a beginner?
Start with a compound interest calculator, such as Investor.gov's, to plan your saving. Then use a fee checker and your country's broker register before you open an account. Charts and screeners matter later.
Do I need to pay for investing research?
Not at first. Official filings, calculators and broker checks are free. Paid plans add speed and extra data, which matter more to active traders than to someone saving each month.
Can an investing tool tell me what to buy?
No tool knows your goals, your timeline or how much risk you can take. Screeners and AI tools can give you ideas to research. Treat any app that promises winners with suspicion.
Is a spreadsheet good enough to track investments?
Yes. Many investors use one. List each holding, what you paid and what you added. Keep deposits separate from gains, and remember that GOOGLEFINANCE prices may be up to 20 minutes late.
Ten stock market simulators compared on starting money, live or delayed prices, lessons, feedback, broker tickets and class tools, with the best fit for each.
11 min readTry it: What can virtual practice reproduce?