


Technical analysis is basically studying a chart to guess where prices might go next. It’s built on one big idea: everything you need to know about a stock – from company news to investor feelings – is already reflected in its price.
So, What Is Technical Analysis Anyway?
Imagine you’re trying to guess the mood of a huge crowd at a concert. Instead of asking every single person how they feel, you just watch how the crowd moves. Are they jumping up and down, swaying gently, or heading for the exits? That’s what technical analysts do with stocks. They don’t get bogged down in a company's financial reports. Instead, they focus on reading the market's mood through its charts.
Think of yourself as a financial detective. You're looking for two main clues to solve the mystery of what happens next:
- Past Price Movements: How has this stock or crypto acted before?
- Trading Volume: How many people are buying or selling it right now?
“The trend is your friend.” – Paul Tudor Jones
This famous line from billionaire hedge fund manager Paul Tudor Jones sums it up perfectly. Your goal is to spot a trend – whether it's up, down, or sideways – and go with the flow instead of fighting it.
This isn’t some new trick, either. Its roots go all the way back to Japanese rice traders in the 1700s. They invented the candlestick charts we still use on our phones and laptops every single day. A little-known fact is that a trader named Munehisa Homma became a legend using these techniques, reportedly making the equivalent of $10 billion in today's money. To get the full picture, it helps to understand what technical analysis truly is from a deeper perspective.
A Time-Tested Approach
The whole idea hangs on one core belief: history tends to repeat itself. Why? Because human emotions, especially fear and greed, don't really change over time. By spotting patterns that have happened before, traders hope to get a statistical edge on what might be coming next.
While it started in Japan, this discipline was really defined in the West by a guy named Charles Dow in the late 1800s (yes, the same Dow from the Dow Jones Industrial Average!). He showed that this is a solid method for making sense of the market, and its principles have been helping traders for centuries.
Learning to Read the Market's Story with Charts
If you want to get into technical analysis, you have to learn the market's language. That language is written on charts. A price chart is like a visual story of a stock's journey, showing every up and down swing and the general vibe of the market.
The easiest place to start is with a basic line chart. It just connects the closing prices over time, giving you a clean, simple view of the trend. It's like reading the summary on the back of a book – you get the main plot points without all the extra details.
Next up, we have bar charts. These add a bit more detail to the story. Each bar gives you four key pieces of info for a period: the open, high, low, and close prices (often called OHLC). With these, you start to see the daily drama, not just where the price ended up.
But for most traders today, the real action is with Japanese candlestick charts.
Understanding Candlesticks
Candlesticks are the go-to for a reason: they are super visual and show the ongoing fight between buyers (called bulls) and sellers (bears). They tell you who's winning the fight with just a single glance.
Every candle has two main parts:
- The Body: This is the thick part. It shows the distance between the opening and closing price. If the body is green (or white), the price closed higher than it opened – a win for the buyers. If it’s red (or black), the price closed lower, meaning the sellers were in control.
- The Wicks: These are the thin lines sticking out from the top and bottom. They show the highest and lowest prices reached during that time. Long wicks can mean the market is unsure or that a big power struggle is happening.
Let's quickly compare the three types.
Three Main Chart Types at a Glance
This table breaks down the key differences to help you see why traders often level up from one chart to the next.
| Chart Type | What It Shows | Best For |
|---|---|---|
| Line Chart | A single line connecting closing prices over a set period. | Seeing the big-picture trend at a glance. |
| Bar Chart | The open, high, low, and close (OHLC) for each period. | Analyzing volatility and price ranges. |
| Candlestick | The OHLC, plus a visual clue about who's in control. | Quickly spotting market sentiment and patterns. |
As you can see, each chart type adds more info, with candlesticks telling the most detailed and immediate story.
This infographic gives you a great visual for how these charts differ.
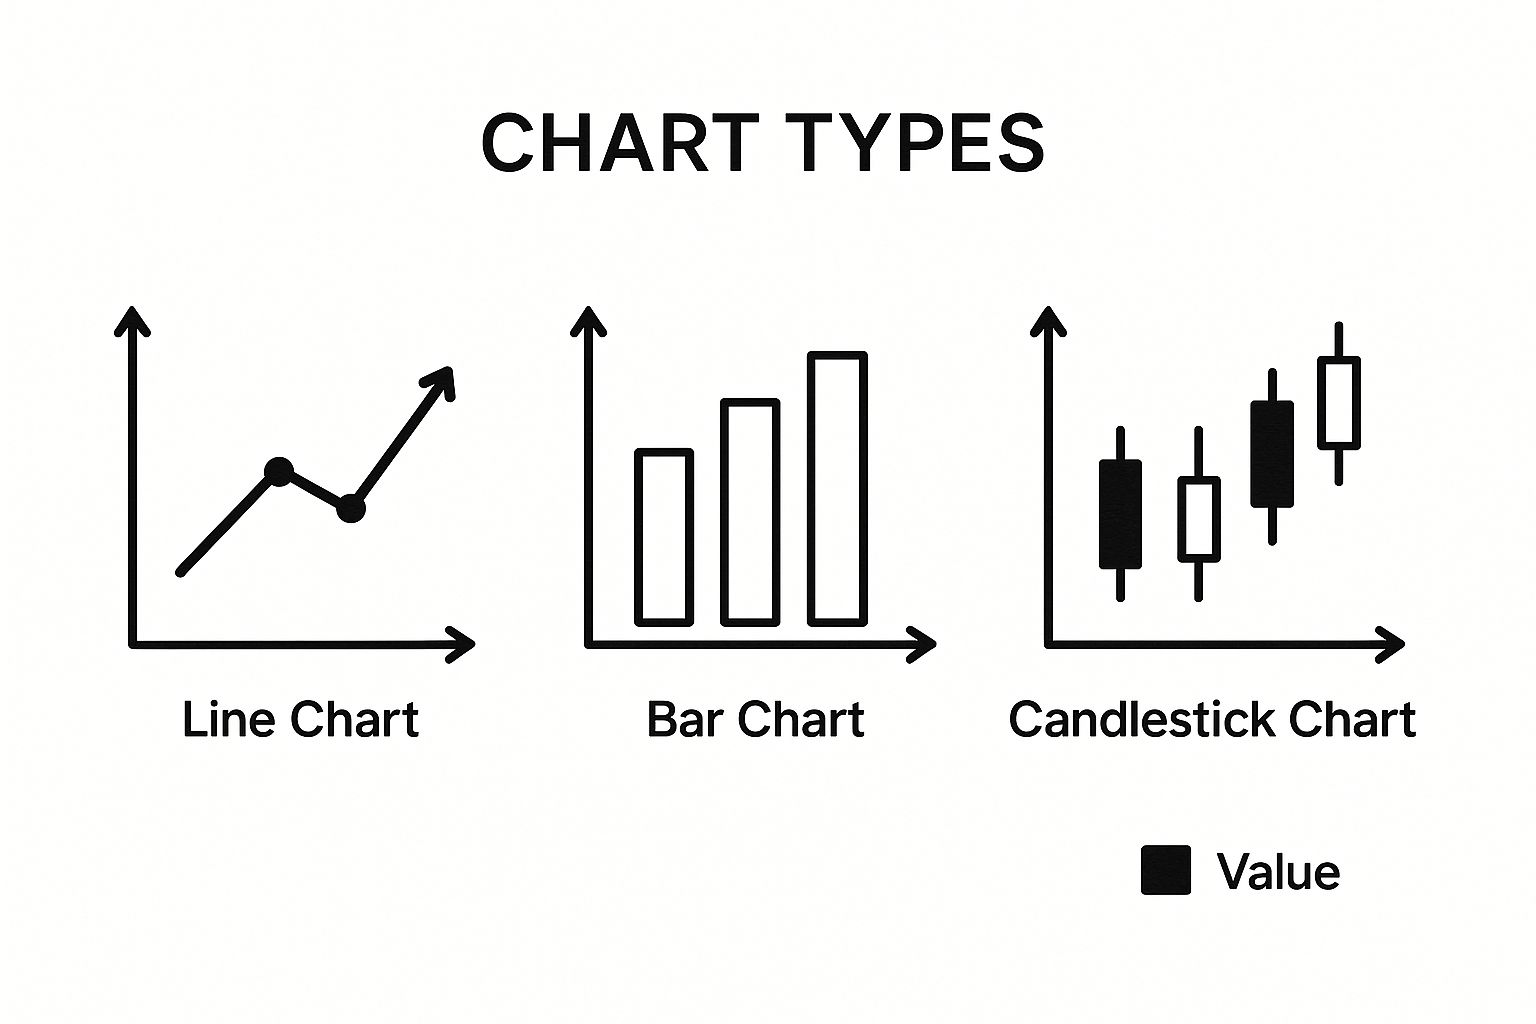
This visual contrast makes it obvious how much more information a candlestick packs in. A long, solid green candle screams "buy!", while a deep red one signals intense selling pressure.
Once you’re comfortable with the basics, you can dive into more advanced resources on how to read forex charts to really sharpen your skills. Learning to read these visual cues is what turns a confusing screen of blinking lights into a clear story about the market.
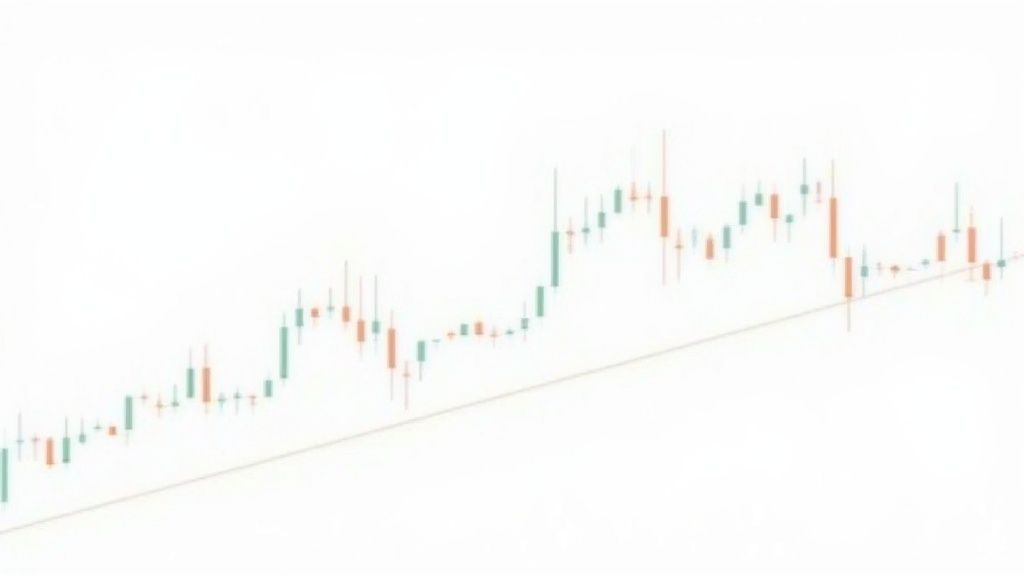
Spotting Trends, Support, and Resistance
You’ve heard the saying, "The trend is your friend," right? It's a classic for a reason. Legendary traders built entire fortunes on this one idea, and it’s one of the first things you need to learn.
Your first job as a chart detective is to figure out which way the market is heading. Generally, it's doing one of three things:
- Uptrend: Imagine a staircase heading up. You'll see a pattern of higher highs and higher lows.
- Downtrend: This is the opposite – a staircase going down, with a series of lower highs and lower lows.
- Sideways Channel: The price isn't really going anywhere. It's just bouncing between two levels, stuck in a rut.
Once you see the trend, you can start finding the most important levels on any chart.
Finding the "Floor" and the "Ceiling"
This is where we talk about support and resistance. Honestly, this is one of the most powerful and simple concepts you'll learn. Imagine the price is a bouncy ball inside a room.
Support is the floor. It’s a price level where buyers tend to jump in, thinking it's a good deal. Their buying pressure is strong enough to stop the price from dropping further, causing it to "bounce" up.
Resistance is the ceiling. This is a price point where sellers usually take over, and the price gets pushed back down. When you see the price hit this ceiling multiple times without breaking through, you've found a solid resistance level.
Learning to draw these lines is like mapping out the market's memory. You're seeing where the big fights between buyers and sellers have happened before.
“Don’t be a hero. Don’t have an ego. Always question yourself and your ability.” – Paul Tudor Jones
That quote is a powerful reminder to trust what the chart is telling you, not what you hope will happen. These levels aren't magic; they're created by thousands of people making decisions. A surprising number of people pay attention to them, from Wall Street pros to celebrity investors like Mark Cuban, who has tweeted about Bitcoin hitting key technical levels.
Knowing where the floor and ceiling are gives you a huge advantage, helping you decide on better spots to get into or out of a trade.
Your Technical Analysis Toolkit: Key Indicators
If charts tell the story of a stock's price, then technical indicators are your high-tech spy gadgets. They help you zoom in, find hidden clues, and see what's really going on. These are basically math formulas based on price or volume that help you confirm a trend or spot a potential change in direction.
Moving Averages (MA): Clearing Up the Noise
Ever looked at a price chart and just felt confused by all the jagged up-and-down lines? It’s like trying to listen to music with a ton of static. That's where the Moving Average (MA) comes in to help.
This simple but powerful tool smooths out all that random price noise by creating a single, flowing line. It shows you the average price over a set period, making it much easier to see the real trend without getting distracted by small daily jumps.
Relative Strength Index (RSI): The Market's Speedometer
Next up is one of the most popular tools in any trader's kit: the Relative Strength Index (RSI). Think of it like a car's speedometer, but for market momentum. It tells you how fast and how far prices have moved.
This tool, the Relative Strength Index (RSI) explained for traders, moves back and forth on a scale from 0 to 100. Its main job is to help you see if a stock is "overbought" or "oversold."
Here's the simple breakdown:
- A reading above 70 often suggests a stock is overbought (too many people have bought it too quickly) and might be ready for a price drop.
- A reading below 30 can signal that it's oversold (too many people sold off) and could be about to bounce back.
It's a fantastic way to check if a strong trend is starting to run out of gas.
These tools work because they tap into the predictable ways people act in the market. As the famous investor George Soros once noted:
“The financial markets generally are unpredictable. So that one has to have different scenarios… The idea that you can actually predict what's going to happen contradicts my way of looking at the market.”
While Soros highlights unpredictability, he also mastered finding market imbalances – something indicators like the RSI help you spot. The cool part? The man who invented the RSI, J. Welles Wilder Jr., was a mechanical engineer before he became a trader. He brought an engineer's mindset to the market, creating tools that are still essential today.
Spotting Classic Chart Patterns
You’ve probably heard the saying, "History doesn't repeat itself, but it often rhymes." In trading, those rhymes show up on charts as specific, repeating shapes. We call these chart patterns.
Think of them as the market's body language. They give you clues about the tug-of-war between buyers and sellers and can hint at where the price might go next. Learning to spot these is a key skill in technical analysis.
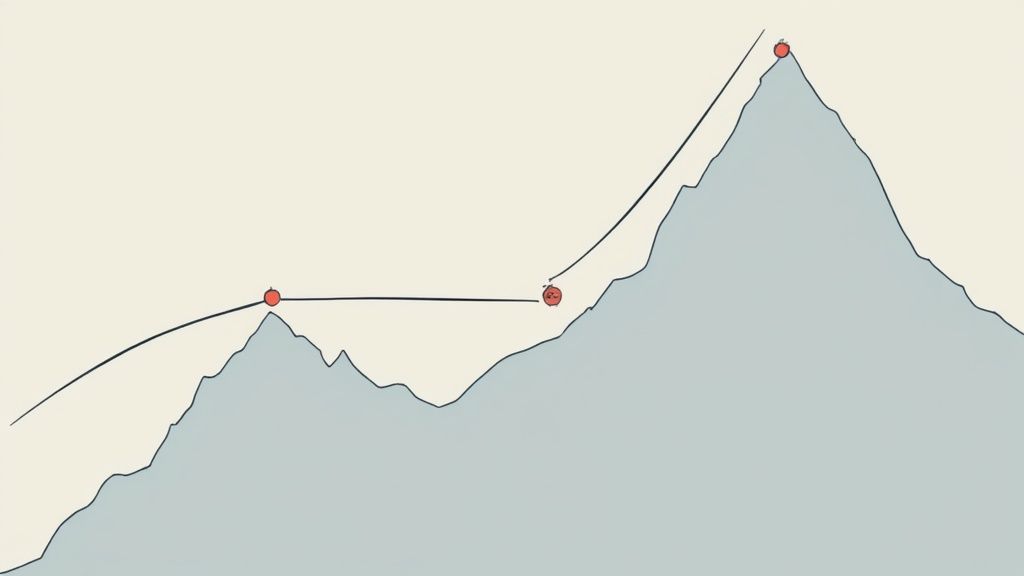
Some patterns are like warning signs. The classic "Head and Shoulders" pattern, for example, often appears when an uptrend is losing steam and might be about to reverse. It looks just like its name suggests: a peak (the left shoulder), a higher peak (the head), and then a final, lower peak (the right shoulder).
Other patterns signal a pause in the action, like a coiled spring building up energy before it bursts.
Key Reversal and Continuation Patterns
Once you start looking, you'll see a few common patterns popping up all the time. Each one tells a different story:
- Double Tops and Bottoms: Imagine a stock hits a price ceiling, falls back, and then hits that same ceiling again without breaking through. That's a Double Top. It’s a strong signal that the upward push has failed. Its opposite, the Double Bottom, looks like a "W" and suggests the price has found a solid floor and might be ready to rise.
- Triangles: These form when the price bounces between highs and lows that get tighter and tighter. This squeezing action shows the market is building up energy, often leading to a powerful breakout move up or down.
“The game of speculation is the most uniformly fascinating game in the world. But it is not a game for the stupid, the mentally lazy, the person of inferior emotional balance, or the get-rich-quick adventurer.” – Jesse Livermore
And this isn't just about finding shapes in the clouds. Scientists from MIT actually studied chart patterns and found that some of them, like the head and shoulders, do have real predictive value. You can dive deeper into the data and how algorithms identify chart patterns to see the science behind it.
Building Your First Trading Plan
All the charts and indicators in the world are like a pro-level gaming setup – totally useless if you don't have a game plan. In trading, your plan is your strategy guide. Its most important job? To protect your money. That is always rule number one.
This all starts with a tool you absolutely must use: the stop-loss. Think of a stop-loss as an automatic eject button. It's an order you set that sells your position if a trade starts going against you. It gets you out before a small, manageable loss turns into a disaster. It is the single best way to protect your account.
Weighing Your Options
Next, you have to decide if a trade is even worth the risk. That's where the risk-to-reward ratio comes in. It's a simple calculation that makes you compare how much you could make versus how much you're willing to lose.
The goal is to only take trades where what you could win is much bigger than what you could lose.
"The key to trading success is emotional discipline. If intelligence were the key, there would be a lot more people making money trading." – Victor Sperandeo
This quote perfectly explains why a plan is so important. It stops you from making emotional, impulsive decisions. A good rule of thumb is to look for at least a 3:1 ratio – meaning you're risking $1 for the chance to make $3. That makes mathematical sense over the long run. Risking $1 just to make 50 cents? That's a bad bet.
Your plan ties everything together. You'll use trendlines, support levels, and indicators to find a smart entry point. But before you ever click "buy," you'll know exactly where you plan to take profits and, just as importantly, where your stop-loss will be.
This isn't about gambling; it's about making smart, disciplined decisions based on your analysis. Once you have a strategy, you should see how it would have worked in the past. You can learn exactly how to do this by exploring how to backtest trading strategies before you risk a single dollar of real money.
Common Questions About Technical Analysis
https://www.youtube.com/embed/qN0-ltRAcV4
As you start learning this stuff, a few questions always pop up. Let's tackle the most common ones to give you a realistic view from the start.
Is Technical Analysis a Guaranteed Way to Make Money?
In a word: no. It's super important to understand this. Technical analysis is not a crystal ball that prints free money.
Think of it more like being a sports analyst. You can study a team's past performance, player stats, and recent games to make a really good guess about who will win, but upsets can always happen. Technical analysis gives you an edge and helps you spot probabilities, but it can never predict the future with 100% certainty. Real success comes from mixing good analysis with smart risk management.
What is the Difference Between Technical and Fundamental Analysis?
This is a classic question, and here’s a simple way to think about it.
A fundamental analyst is like a detective investigating a company. They read financial reports, check out the management team, and try to figure out a company's true value – what it should be worth. Warren Buffett is the most famous fundamental investor in the world.
A technical analyst is more like a crowd psychologist. They don't care about the company's earnings reports; they only look at the price chart. They believe all that fundamental info is already baked into the price, so their job is to figure out the market's mood and predict what the crowd will do next.
"The charts are the truth of the market." – Paul Tudor Jones
This famous line perfectly captures the technical mindset. For them, the price tells the whole story.
Where Is the Best Place to Start Practicing?
The absolute best way to learn is by doing – but without risking your own money. The solution? Open a "paper trading" account.
Most online brokers offer these free demo accounts that give you virtual money to trade in the real, live market. It’s like a flight simulator for traders. You can test your strategies, place trades, make mistakes, and learn how everything works without any financial risk. It's the perfect training ground to build confidence before you ever go live.
At Finance Illustrated, our mission is to make financial education clear and accessible for everyone. Start building your skills today with our free courses and risk-free trading simulators at https://financeillustrated.com.