

Trading skills
5 Famous Forex Traders: Their Stories and What They Can Teach You
Meet five famous currency and macro traders: Lipschutz, Soros, Kovner, Druckenmiller and Tudor Jones. Learn what their stories show, and what they hide.
Technical analysis means reading past prices to describe what a market did. Learn the main tools, and how to test a chart idea before you trust it.

means studying past prices on a chart to describe how a market has moved. Many traders also look at : how many shares or contracts changed hands. From what they see, they try to write trading rules.
It is different from , which studies what is behind a price, such as a company's profits or a country's interest rates. Many people use a little of both.
The ideas are old. Candlestick charts are often traced back to rice traders in Japan in the 1700s, and Charles Dow wrote about market around 1900.
The most useful first skill is to keep two things apart. "The last three daily closes went up" is a fact you can see. "Buyers are now sure to win" is a story. A chart shows prices from one data source. It does not show what every trader was thinking.
There are three common chart types. A joins the closing prices. Bar charts and candlestick charts also show the open, high and low of each period: see how to read candlesticks. Stock and forex charts can look alike but use different data, so also read how to read forex charts.
is a price area where falls have stopped before, like a floor. is an area where rises have stopped before, like a ceiling. Traders draw them as lines, but they work better as zones a little above and below the line.
CME Group explains common ways to find these areas. But a level only describes the past. When the price comes back, it can bounce again or break straight through. The line does not force anything to happen.
To test a support idea, write down how wide the zone is, how many past touches it needs, and from when it counts. Then record the breaks as well as the bounces. If you only remember the bounces, the level will look far more reliable than it is.
Try it yourself
Tap the chart where you think support is: the price where falls kept stopping. You can also move the guide line with the arrow keys. You get 3 tries.
In this practice chart, the price keeps falling to about 96 and bouncing back up, so a trader would call the area around 96 support. The next fall to 96 could still break straight through it.
What would you expect?
What this shows: Support is a zone you draw from past bounces. It shows where falls stopped before, not where the next fall must stop.
Every touch you found is history. When the price comes back to the zone, it can bounce or break through, so treat the level as an idea to test.
A trend is the general direction of prices over a period. In an uptrend, each high is higher than the last one, and each low is higher too. In a downtrend, the highs and lows keep getting lower. In a sideways range, prices move back and forth between two areas.
The answer depends on the you choose: hourly, daily or weekly prices, for example. A short rise on an hourly chart can sit inside a long fall on a weekly chart. Both are true at the same time.
So pick your time frame before you look, and stick to it. If you keep switching charts until one agrees with you, you are not testing an idea. You are only looking for proof of what you already believe.
A is the average of the last few closing prices. It smooths out small jumps, so the direction is easier to see.
The average is smooth, but it is always a little late, because it is built from old prices. An exponential moving average gives recent prices more weight, so it reacts faster.
Faster is not always better. In a choppy market, a fast average can flip up and down again and again. CME Group compares the main types.
The (Relative Strength Index) compares recent up moves with recent down moves. It runs from 0 to 100. Readings above 70 are often called "overbought", and readings below 30 "oversold".
Those are labels, not orders to sell or buy. RSI can stay high or low for a long time during a strong trend.
Most free charting tools can draw RSI for you. Our free investing tools guide compares a few.
are two lines drawn around a moving average. The lines move further apart when prices swing more. Their creator, John Bollinger, says in his published rules that a touch of a band is not, on its own, a signal to buy or sell.
One more trap: most indicators are built from the same prices. If two indicators rise because the last close rose, you have one fact, not two.
Chart patterns such as double tops, head and shoulders and triangles have famous names. A name is not a success rate. To test a pattern, or any chart idea, you need a very clear rule. It should be so clear that two people would mark the same trades on a new chart.
| Vague idea | What you must decide |
|---|---|
| Buy a strong trend | Which prices, which time frame, and what counts as strong? |
| Wait for confirmation | What must happen, and when would you know it? |
| Use a tight stop | Where exactly, how big a position, and what if the price jumps past it? |
| Only take big targets | How often are they really reached, and how much do costs take? |
Watch out for hindsight. A perfect turning point is easy to spot once later prices exist. The real question is whether a rule that used only what you knew at the time worked, after costs. A target 3 times bigger than your planned loss still loses money if it is reached too rarely.
Test one idea at a time and keep the first version. Our backtesting guide shows how to test without fooling yourself, and three popular chart patterns gives you ideas to practise on.
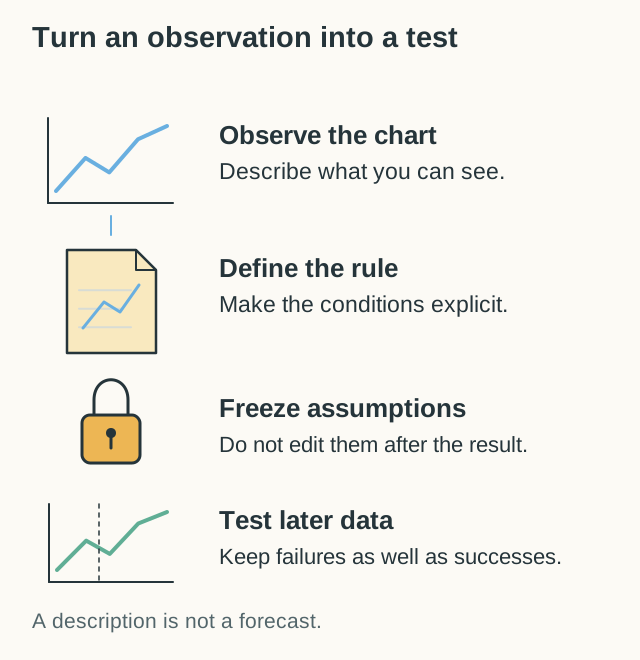
It can help you describe a market and write clear rules. It cannot tell you for sure what happens next. Whether a rule helps after costs is something you have to test, on data you did not use to invent it.
Technical analysis studies prices and volume on charts. Fundamental analysis studies what is behind the price, such as a company's profits or a country's interest rates. Many investors use a little of both.
A simple moving average is a good start, because you can work it out by hand. Learn what one indicator measures before you add more. Many indicators use the same prices, so adding more does not add new facts.
Meet five famous currency and macro traders: Lipschutz, Soros, Kovner, Druckenmiller and Tudor Jones. Learn what their stories show, and what they hide.

Seven daily trading habits for beginners: plan before you trade, size from your stop, check the calendar, know your orders, count costs and review.