Your Ultimate Beginner Forex Trading Course to Start Smart

ye

Think of a beginner forex trading course as your personal cheat code for the financial markets-it’s where you learn the rules of the game before you put any real money on the line. These courses are designed to build your skills and confidence, taking you from a curious spectator to a prepared trader.

Why A Forex Course Is Your Smartest First Move

Ever feel like the world of finance is some exclusive club you weren't invited to? Let's fix that.

Jumping into forex trading without any training is like trying to beat a video game on the hardest difficulty without ever playing the tutorial. It's a quick way to lose. A structured course is your map and your strategy guide, all rolled into one, giving you a solid footing from day one.

Forex trading charts displayed on multiple screens, showing financial data and trends.

Look at legendary investors like George Soros. He's known as "The Man Who Broke the Bank of England" after he famously made a billion dollars in a single day betting against the British pound in 1992. His incredible success wasn't built on luck; it came from a deep understanding of market rules and human psychology. He famously said, "The financial markets generally are unpredictable… The idea that you can actually predict what's going to happen contradicts my way of looking at the market."

This gets right to the heart of it: you need a strategy, not a crystal ball. That's the exact mindset a good course helps you build.

Building Skills, Not Just Knowledge

A quality beginner forex course does more than just dump a textbook's worth of facts on you. It’s all about building practical, real-world skills. You're not just memorizing terms; you're learning how to think like a trader.

Here's a quick look at the essential skills you'll gain from a foundational forex trading course.

What a Beginner Forex Course Actually Teaches You

Skill Category What You Learn Why It Matters for You
Market Fundamentals The "why" behind price movements-economic news, interest rates, global events. You'll stop seeing charts as random squiggles and start understanding the stories they tell.
Risk Management How to protect your starting capital with stop-losses and proper position sizing. This is your financial seatbelt. It's the #1 skill that separates successful traders from gamblers.
Trading Psychology How to control fear and greed, stick to your plan, and make disciplined decisions. Your own emotions can be your biggest enemy. This helps you stay in control when real money is on the line.
Technical Analysis How to read charts, identify trends, and use indicators to find potential entry/exit points. This is your toolkit for making informed predictions about where the market might go next.
Strategy Development How to build a personalized trading plan that fits your goals and risk tolerance. A trading plan is your personal rulebook. It keeps you from making impulsive, emotional mistakes.

This systematic approach is why so many traders invest in their education first. In fact, with over half of traders buying educational materials each year, it's clear that structured learning is seen as a vital part of building a sustainable trading career.

Modern courses have come a long way from dry PDFs. To see just how powerful new learning methods can be, it's worth understanding the benefits of interactive video for corporate training, which are now being used to make complex trading topics much easier to absorb.

Instead of making expensive mistakes with your own money, a course gives you a safe space to learn from the wins and losses of others. It helps you manage your expectations and sets you on a path to becoming a disciplined, informed trader.

Learning the Language of Forex Trading

Before you can even think about trading, you need to learn how to speak the language. The forex market is like a massive global conversation that runs 24/5, and a good beginner forex trading course acts as your personal translator, cutting through all the confusing terms.

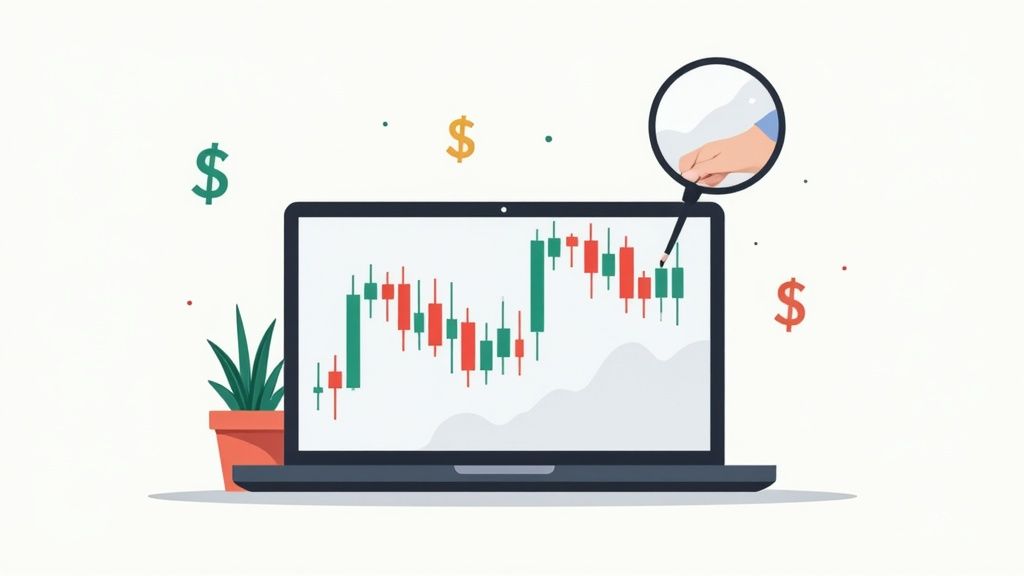
A person studying forex charts and financial data on a laptop, with a notebook nearby.

This conversation is built on a handful of core concepts. Without them, you're essentially flying blind. Our mission is to demystify the jargon so you can glance at a trading platform and actually understand what’s happening.

"An investment in knowledge pays the best interest." – Benjamin Franklin

Nowhere is this truer than in trading. Getting a handle on the vocabulary is your first real investment, and it’s the one that safeguards every other dollar you’ll put on the line later.

Your First Forex Words

Let's start with the absolute essentials. Think of these as the foundational building blocks you can't trade without.

  • Currency Pairs: Currencies are always traded against each other, like EUR/USD. The easiest way to think about it is like a tug-of-war between two economies (in this case, the Eurozone and the United States). You’re essentially placing a bet on which side will pull harder. If you want to really nail this down, our guide on how to read currency pairs is the perfect next step.

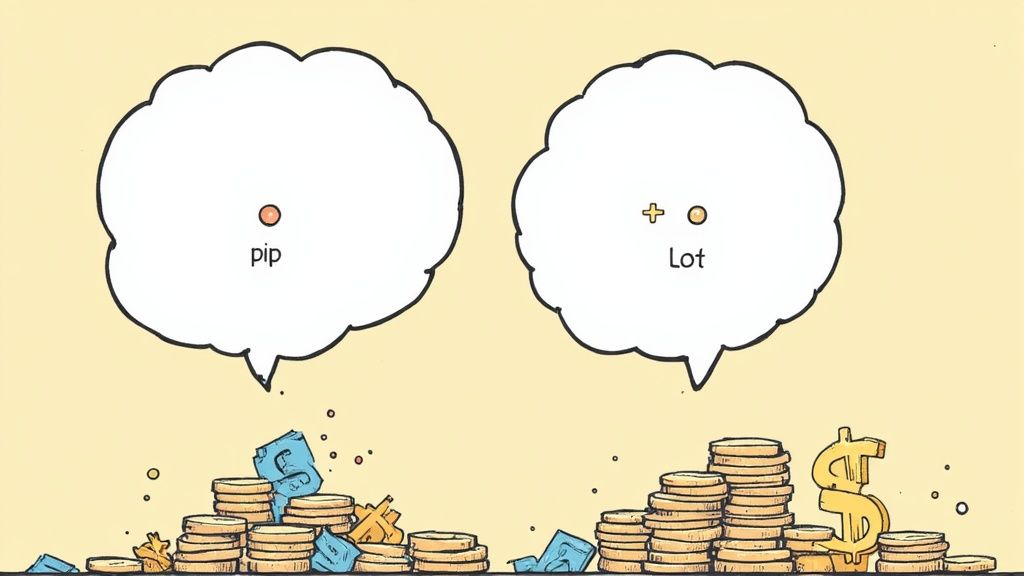
  • Pip: A 'Pip' is short for 'Percentage in Point.' It's the smallest possible price move a currency pair can make. Think of it as a single point in a basketball game-one point might not seem like much, but they add up fast and ultimately decide who wins or loses the trade.

  • Leverage: This is a powerful tool, kind of like using a car jack to lift a two-ton vehicle with minimal effort. In trading, leverage lets you control a large position with a relatively small amount of your own money. It’s fantastic for amplifying profits, but it's a double-edged sword that will just as easily amplify your losses if a trade goes against you.

  • Lot Size: This term simply refers to how big your trade is. A standard lot is 100,000 units of currency, but don’t let that number scare you. Brokers offer mini and micro lots, which are perfect for beginners who are starting out with a smaller account.

To really get the most out of your learning, it helps to understand your own personal strengths. Digging into the different learning styles in adults can make the whole process click much faster. By the time you wrap up a solid introductory course, you'll have the vocabulary you need to follow market news and place your first trades with confidence.

Choosing Your Tools of the Trade

Every craftsman needs their tools, and traders are no different. Before you even dream of placing that first trade, you've got to get your hands dirty with your main piece of kit: the trading platform. This is your command center, your digital cockpit where all the magic happens.

Think of it like the dashboard of a race car. It shows you the track ahead (the charts), lets you monitor your speed, and gives you the controls to accelerate, brake, and steer. For traders, this is where you’ll size up the market and put your money to work.

Any beginner forex trading course worth its salt will spend a good chunk of time making sure you master this. It’s the arena where you'll be competing, and knowing it like the back of your hand is simply non-negotiable.

Your First Trading Platform

For most folks just starting out, one name pops up over and over again: MetaTrader 4, or MT4. You can think of it as the Swiss Army knife for traders-it’s the industry standard, loaded with powerful features, yet it's surprisingly easy to get the hang of once you learn the ropes.

It’s so popular that a staggering 85% of forex traders rely on the MT4 platform. That massive user base is a huge plus, meaning there's a giant community and endless tutorials out there to help you find your footing. To get a better sense of how traders use these tools, it's worth checking out some current forex trading statistics.

Learning to Read the Story in the Charts

Once you’ve got your platform set up, the next big hurdle is learning to read charts. At first glance, they might just look like a chaotic scribble of lines from a heart monitor, but they’re actually telling a powerful story-a visual tug-of-war between buyers and sellers.

Your job is to become a storyteller, to learn how to interpret that narrative. Most successful traders, especially when they’re new, find that simplicity is their best friend. They stick to daily charts. Looking at the market one day at a time helps filter out all the distracting short-term “noise” and gives you a much clearer, big-picture view of where things are actually headed.

"The goal of a successful trader is to make the best trades. Money is secondary." – Alexander Elder

This quote nails the mindset you need. Focus on learning your tools and reading the charts properly first. The profits will follow. By getting comfortable with your platform and learning to read the market's story on a daily chart, you’re laying the solid foundation you need to trade smarter and with more confidence.

The Most Important Lesson: Protecting Your Capital

This is the chapter that separates traders from gamblers. If there's one single lesson in any beginner forex trading course that matters more than all the others, it's this one: learn how to protect your money. It’s not about hitting that one-in-a-million trade; it's about staying in the game long enough to build consistent wins.

Legendary investor Warren Buffett summed it up perfectly with his two famous rules.

"Rule No. 1: Never lose money. Rule No. 2: Never forget rule No. 1."

What he’s really saying is that your number one job is to play defense. One massive loss can completely erase a dozen smaller wins and kick you out of the market for good. To make sure that doesn't happen, you have to learn how to manage risk like a professional.

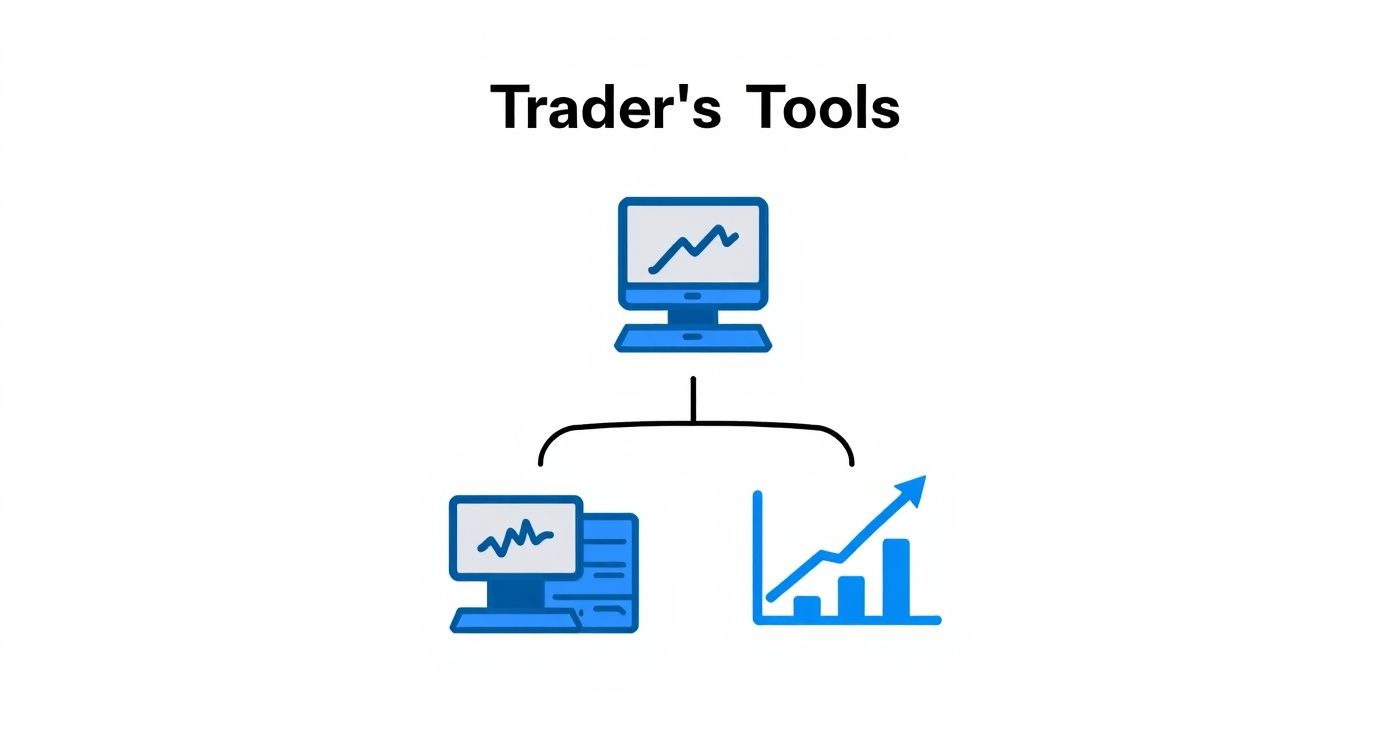
This infographic breaks down the essential tools you'll be using to control your trades and keep your capital safe.

Infographic about beginner forex trading course

As you can see, everything starts with your trading platform. From there, you use your charts and analysis to make decisions, but it's the risk management tools that truly keep you in control.

Your Financial Escape Hatch

Your best defensive move in trading is the Stop-Loss. Think of it as a pre-set eject button for your trade. It's an order you place with your broker that basically says, "If this trade starts losing a certain amount of money, get me out immediately." No questions asked.

This is your safety net. It’s what prevents a small, acceptable loss from spiraling into a catastrophic one that blows up your account. For professional traders, setting a stop-loss on every single trade isn't optional-it's a non-negotiable rule that ensures they live to trade another day.

Another dead-simple but incredibly powerful defensive strategy is the 1% Rule. It’s a personal guideline where you promise yourself you will never risk more than 1% of your total trading capital on any single trade.

  • If you have a $1,000 account, your maximum risk per trade is $10.
  • If you have a $500 account, your maximum risk per trade is just $5.

Before placing any real trades, it's crucial to get comfortable with a few fundamental risk-control methods.

Simple Risk Management Techniques

Technique How It Works for You Simple Analogy
Stop-Loss Order Automatically closes a trade at a pre-set price to cap your losses. It's like setting a fire alarm. If things get too hot, it goes off and gets you out before the whole house burns down.
The 1% Rule Never risk more than 1% of your account on a single trade. Think of it as betting rules at a casino. You only bet a tiny fraction of your chips at once so one bad hand doesn't wipe you out.
Position Sizing Adjusting your trade size based on your stop-loss distance and the 1% rule. It’s like pouring a drink. You pour less into a small glass and more into a big one to avoid spilling over.

Sticking to these rules makes it almost mathematically impossible to lose your entire account quickly. It forces you to be disciplined, make smarter decisions, and survive the losing streaks that every single trader-even the best in the world-goes through.

Winning in trading is a marathon, not a sprint. These defensive rules are how you build the endurance to cross the finish line.

Putting Your Knowledge into Practice

Theory is great, but the real learning happens when you roll up your sleeves and get your hands dirty. It’s time to gain some practical experience without putting a single dollar of your own money on the line. This is where the beginner forex trading course introduces its most powerful tool: the "demo account."

Think of a demo account as a trading simulator. It's the flight simulator for a pilot, the driving range for a golfer. It’s your own personal sandbox where you can test-drive everything you've learned in a completely safe space. This is where you’ll click the button on your first trade, set a stop-loss, and watch how the market actually behaves.

Even celebrities who get into trading, like Michelle Williams, started right here at the beginning. She reportedly won a world championship trading competition-turning $10,000 into $100,000 in under a year-after taking a course and learning the fundamentals, proving that practice always comes before profit.

Your First Practice Trades

The goal here isn't to become a paper millionaire overnight. It's about building confidence and, more importantly, developing good habits from the very start. The experience you gain is far more valuable than any fake profit you rack up. Before diving in, you might also want to learn how to backtest trading strategies, which is an awesome way to test your ideas against historical market data.

Here’s a simple game plan for your first few sessions in the simulator:

  • Pick a Major Pair: Keep it simple. Start with a heavyweight pair like EUR/USD or USD/JPY. They tend to be more predictable and are easier to follow for beginners.
  • Place a Small Trade: Just get a feel for the mechanics of opening a position. Don't overthink it.
  • Set a Stop-Loss: This one is non-negotiable. Practice protecting your capital on every single trade, right from day one. Make it muscle memory.
  • Watch and Learn: Now, just observe. See how the price reacts to news events or economic data releases. Get a feel for the rhythm of the market.

This risk-free practice is the essential bridge between knowing the theory and actually trading. It’s fun, it’s educational, and it's an absolute must for any new trader.

Your Questions Answered

Got a few questions rattling around in your head? Good. That’s a sign you're taking this seriously. It's totally normal to be curious-or even a little skeptical-before jumping into something new like a beginner forex course.

Let's cut through the noise and tackle the big questions head-on. My goal is to give you straight answers so you can move forward with confidence.

Is It Too Late to Start Forex Trading?

Not a chance. It might feel like everyone else got a head start, but new traders are jumping into the market every single day. And it’s not just for the young, tech-savvy crowd, either.

You might be surprised to learn that a huge chunk of traders are more mature. In 2025, there are about 1.3 million forex traders in the US alone, and a massive 58% of them are over the age of 40. People from every walk of life are starting their trading journey right now. You can dive deeper into the US forex trading demographics here.

Do I Need a Lot of Money to Start?

This is one of the biggest myths holding people back. You absolutely do not need a massive bankroll to get your feet wet, thanks to things like leverage and micro accounts. Many brokers will let you open an account with $100 or even less.

What a good course really drills into you is how to manage that small account effectively. The focus isn't on the size of your starting capital, but on how smart you are with protecting and growing it.

"The secret to being successful from a trading perspective is to have an indefatigable and an undying and unquenchable thirst for information and knowledge." – Paul Tudor Jones

That quote from a trading legend says it all. Your most valuable asset isn't your money; it's your drive to learn how to do this the right way.

How Long Does It Take to Learn?

There’s no magic number here-everyone picks things up at their own speed. But a solid introductory course can get you comfortable with the absolute essentials in just a few weeks of focused effort.

A realistic timeline might look something like this:

  • Weeks 1-2: Getting a grip on the core lingo and basic concepts.
  • Months 1-2: Practicing what you've learned on a demo account without risking a dime.
  • Months 3-6: Feeling ready to trade with very small amounts of real money.

Becoming a consistently profitable trader is a marathon, not a sprint. The first step is just committing to learn the fundamentals, and a well-built course is your shortcut to getting there.


Ready to stop wondering and start doing? The free Trading School at financeillustrated.com will walk you through the basics of forex in about an hour. Jump in and start building real confidence today at https://financeillustrated.com.

How to Read Forex Charts: A Beginner’s Guide

ye

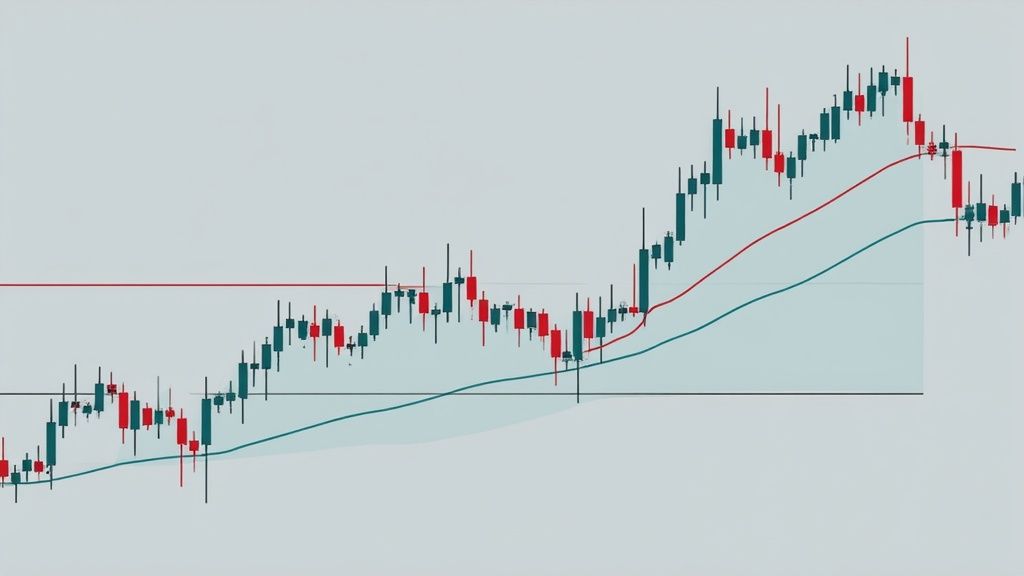
Learning how to read forex charts comes down to three main types: line, bar, and candlestick charts. Each one tells the story of a currency pair’s price movement, but candlestick charts are easily the most popular. Why? Because they pack the most crucial details—the open, high, low, and close prices—into a single, easy-to-read shape that gives you actionable insights at a glance.

Your First Look at Forex Charts

Welcome to the world of forex trading. Before you dive into complex algorithms or "secret" signals, let's focus on your most powerful tool: the chart right in front of you.

Think of it as a live storybook. Every tick and candle chronicles the constant tug-of-war between buyers (bulls) and sellers (bears). Learning to read that story is your first and most important step toward making smart, informed trades.

For a newcomer, the screen can look like a chaotic mess of lines and colors. Don't worry. It all starts with understanding the basic ways price is drawn on the chart.

The Three Main Chart Types

Most trading platforms give you a few ways to visualize the market's pulse. Each has its own purpose and offers a different level of detail. Let's break them down so you can choose the right tool for the job.

Here’s a quick rundown of the big three and what they're good for:

Quick Guide to Forex Chart Types

Chart Type What It Shows Best For
Line Chart A single line connecting closing prices. Seeing the big-picture trend at a glance.
Bar Chart Open, High, Low, and Close (OHLC) prices. Analyzing volatility within a period.
Candlestick Chart Open, High, Low, and Close (OHLC) prices. Quickly interpreting market sentiment and momentum.

While all three have their place, you’ll find that most experienced traders live and breathe by candlestick charts. Let's see why.

  • Line Charts: This is your most basic view. It connects the closing prices over time, giving you a clean, simple line. It’s perfect for spotting long-term trends without noise, but it hides the intraday price swings.
  • Bar Charts: These take it up a notch. Also known as OHLC charts, they show the Open, High, Low, and Close for each period. Suddenly, you can see how volatile the market was—a huge piece of the puzzle that line charts leave out.
  • Candlestick Charts: This is the go-to for the vast majority of traders, and for good reason. They show the same OHLC data as bar charts, but the visual design—a solid "body" with thin "wicks"—makes it incredibly intuitive to gauge market sentiment in an instant.

Candlestick charts, which trace back to 18th-century Japanese rice traders, are incredibly information-dense. Each candle gives you four critical data points, making them a powerful tool for dissecting market dynamics. That level of detail is essential in a market where daily trading volumes averaged a staggering $7.51 trillion in April 2022. That immense liquidity fuels the price action you’re trying to decode. Discover more insights about forex trading volume on bestbrokers.com.

Line and bar charts definitely have their uses, but we’re going to spend most of our time on candlesticks because they’re the industry standard. They don’t just give you numbers; they show you the market’s mood. A long green candle screams buying pressure, while a small red one with long wicks hints at confusion and indecision. This is your first step to gaining actionable insights.

Of course, before you can analyze the candles, you need to know what you're even looking at. Be sure to get a handle on the assets themselves—you can learn more about how to read currency pairs in our article to build that foundation.

Next up, we’ll dive into what these candles are really telling you.

Reading the Story of Candlestick Patterns

Okay, we’ve looked at the big three chart types, but let's be honest—for most of us, it’s all about the candlestick chart. If a line chart gives you the headline, candlesticks give you the full, unfiltered story. Each candle is a rich, visual summary of the battle between buyers and sellers within a specific timeframe.

Image

Think of every single candle as a chapter in the market's story. Learning to read these chapters, both individually and strung together, is one of the most fundamental and valuable skills you'll develop as a trader.

Deconstructing a Candlestick

Before you can spot patterns, you need to understand the anatomy of a single candle. It looks more complex than it is, but every piece tells you something important. Each candle simply represents all the price action over whatever period you’ve chosen—a minute, an hour, a day, you name it.

Every candle is made of two key parts:

  • The Body: This is the thick, rectangular part. It shows you the distance between where the price opened and where it closed for that period. The color is your first clue: a green (bullish) candle means the price closed higher than it opened. A red (bearish) candle means it closed lower. Simple.
  • The Wicks (or Shadows): These are the thin lines sticking out from the top and bottom of the body. The very top of the upper wick is the highest price the market hit during that period, and the bottom of the lower wick is the lowest.

Here's an actionable tip: pay attention to wick length. Long wicks can signal volatility and indecision. It means the price traveled a long way but was pushed back before the candle closed. Conversely, a candle with a large body and tiny wicks suggests strong, decisive momentum.

For a deeper dive into the nitty-gritty, our guide on how to read candlesticks in financial markets is a great next step.

Common Patterns That Signal Market Moves

A single candle tells you a lot, but the real magic happens when you see them forming patterns together. These are recurring formations that can give you a heads-up about a potential trend reversal or suggest the current trend is just getting started. They aren't crystal balls, but they are powerful clues about market psychology.

Let's walk through a few of the most important ones you'll see time and time again.

Reversal Patterns: Clues of a Turning Tide

Reversal patterns suggest the current trend is losing steam and might be about to flip. Spotting one of these near a key support or resistance level can be a game-changing insight.

A classic example is the Hammer. This pattern appears after a downtrend and has a short body at the top with a long lower wick. It visually represents buyers stepping in with force to push the price back up after sellers tried to tank it, signaling that bullish momentum might be building.

Another powerful reversal signal is the Engulfing pattern.

  • A Bullish Engulfing pattern happens when a big green candle completely "engulfs" the body of the previous, smaller red candle. It's a dramatic visual shift showing that buyers have just overwhelmed the sellers.
  • A Bearish Engulfing is the opposite—a huge red candle swallows the previous smaller green one, signaling that sellers have seized control.

Actionable Insight: Imagine you're watching the EUR/USD pair drift lower. Suddenly, a Bullish Engulfing pattern forms right on top of a known support level. This isn't random noise; it's a powerful visual cue that selling pressure is exhausted and a rally could be on the cards.

Continuation Patterns: Signs the Trend Will Keep Going

Not every pattern is about a dramatic reversal. Some just tell you that after a quick breather, the trend you're in is likely to keep rolling.

One of the most straightforward is a series of large-bodied candles of the same color. For example, seeing three long green candles in a row (often called "Three White Soldiers") is a strong confirmation that the bullish trend is healthy and has more room to run.

The Indecisive Doji

Sometimes, the market just pauses, completely unsure of its next move. This moment of indecision is perfectly captured by the Doji candlestick. A Doji has a tiny, almost non-existent body, meaning the open and close prices were nearly identical. It often has long upper and lower wicks, making it look like a cross or a plus sign.

A Doji represents a stalemate between buyers and sellers. When you see a Doji pop up after a strong, established trend, it’s an early warning sign that momentum is fading. It’s the market taking a deep breath before deciding where to go next.

When you put it all together, candlestick patterns are the language of the market. They turn a sterile price chart into a dynamic narrative of fear, greed, and indecision. Learning to interpret this story is your next big step toward becoming a more confident and analytical trader.

Adding Technical Indicators to Your Analysis

Candlestick patterns give you a fantastic real-time look at market psychology, but what if you want to add a layer of statistical muscle to your analysis? This is where technical indicators come in. Think of them as specialized lenses you can overlay on your chart to help clarify the story the price is telling.

Image

Now, indicators aren't magic crystal balls; they are simply mathematical calculations based on historical price or volume. Their real job is to help you make more objective, data-driven decisions about where the price might go next.

We’ll focus on three of the most trusted types: trend, momentum, and volatility indicators.

Tracking the Trend with Moving Averages

One of the first questions to ask when you open a chart is, "Which way is the market headed?" Moving Averages (MAs) are the perfect tool for getting a quick, clean answer.

An MA smooths out the raw price data by creating a constantly updated average price. This helps you filter out the "noise" from short-term price spikes and see the underlying trend more clearly. The two you'll run into most often are the Simple Moving Average (SMA) and the Exponential Moving Average (EMA).

  • Simple Moving Average (SMA): This is the simple average of a price over a set number of periods. A 50-day SMA, for example, adds up the closing prices for the last 50 days and divides by 50.
  • Exponential Moving Average (EMA): This one is a bit more sophisticated. It gives more weight to the most recent prices, which makes it react more quickly to new price action.

A classic strategy traders watch for is the "crossover." This happens when a shorter-term MA (like a 50-day) crosses above or below a longer-term MA (like a 200-day). For instance, when the 50-day MA crosses above the 200-day MA—an event known as a golden cross—it often signals a higher probability of price appreciation.

Given that spot trading in the US forex market accounted for roughly $602.29 billion of daily turnover in April 2025, these volumes create rapid changes that indicators help us interpret. You can get more details on global currency market activity from Statista.

Measuring Momentum with the RSI

Moving averages are great for showing you the direction of the trend, but they don't tell you how strong it is. To get a feel for the power behind the move, we turn to momentum indicators like the Relative Strength Index (RSI).

The RSI is an oscillator that moves on a scale from 0 to 100. It measures the speed and change of price movements, helping you spot potentially "overbought" or "oversold" conditions.

Here’s the general interpretation:

  • Overbought: A reading above 70 suggests a currency pair might be over-valued and due for a pullback.
  • Oversold: A reading below 30 suggests the pair could be under-valued and poised for a rebound.

Actionable Insight: A common mistake is to sell the moment the RSI hits 70. A strong trend can stay "overbought" for a long time! A smarter approach is to use it as a warning sign. Wait for the RSI to cross back down below 70 and look for a bearish candlestick pattern to confirm that momentum is actually shifting.

The RSI is also fantastic for spotting divergence. This is when the price makes a new high, but the RSI makes a lower high. This "bearish divergence" is a classic clue that the underlying momentum is weakening and the trend could be losing steam.

Understanding Volatility with Bollinger Bands

The forex market isn't always trending smoothly. Volatility indicators like Bollinger Bands help you gauge the current market mood.

Created by John Bollinger, this indicator plots three lines directly on your price chart:

  1. A simple moving average in the middle (usually a 20-period SMA).
  2. An upper band (two standard deviations above the SMA).
  3. A lower band (two standard deviations below the SMA).

When volatility is high, the bands expand. When the market is quiet, they contract or "squeeze." This squeeze is a trader's best friend—it often signals that a big, explosive move is brewing.

Traders use Bollinger Bands in a few clever ways. Some view the upper and lower bands as dynamic support and resistance levels. For example, if the price touches the lower band and then prints a strong bullish candle, it could be a solid buy signal.

By combining these three types of indicators, you get a much richer view of what's happening. You can use moving averages to confirm the trend, the RSI to gauge its strength, and Bollinger Bands to understand the current volatility. Together, they help you build a more complete, logical case before you place a trade.

Drawing Support, Resistance, and Trend Lines

While automated indicators are great, some of the most powerful insights come from tools you draw yourself. Learning to interact directly with the chart is a huge step forward. It forces you to see the market's underlying structure and pinpoint the real battlegrounds between buyers and sellers.

Image

This hands-on approach shifts you from being a passive observer to an active analyst. These simple lines provide critical context to candlestick patterns and indicator signals, helping you build a much stronger case for every trade you consider.

Identifying Support and Resistance Levels

Think of support and resistance as price floors and ceilings. These are horizontal levels on your chart where the price has repeatedly struggled to push through, representing zones where demand (support) or supply (resistance) is concentrated.

  • Support: This is a price "floor" where buying pressure has historically been strong enough to stop a fall and cause the price to bounce back up.
  • Resistance: This is the opposite—a price "ceiling" where selling pressure has consistently overwhelmed buyers, forcing the price back down.

To find these levels, scan your chart for areas where the price has reversed multiple times. The key is to connect at least two or three significant swing lows (for support) or swing highs (for resistance) with a horizontal line.

Pro Tip: Don't treat support and resistance as razor-thin lines. It’s far more realistic to see them as zones or areas. Price often pokes through a level slightly before reversing, and thinking in zones will keep you from getting faked out by these small overshoots.

A powerful concept to watch for is "role reversal." When a major resistance level is finally broken, it often becomes the new support level. The psychology of the market flips; traders who were selling at that ceiling now see it as a bargain and start buying at the new floor.

How to Draw Effective Trend Lines

If support and resistance map out the horizontal barriers, trend lines help you visualize the direction and momentum of the current trend. These are diagonal lines that connect key price points, essentially acting as dynamic boundaries for the price.

Drawing them is simple, but it takes a bit of practice to get a feel for it.

  • For an uptrend: Draw a line connecting two or more significant swing lows. This line should sit below the price, acting as a rising floor of support. Every time the price pulls back, touches this line, and bounces, it's another confirmation of the uptrend's strength.
  • For a downtrend: Do the opposite. Connect two or more significant swing highs. This line will sit above the price, creating a falling ceiling of resistance.

Pay attention to the angle of your trend line—it tells a story. A steep line suggests powerful momentum that might burn out quickly, while a shallow line points to a weaker, more gradual trend.

A break of a well-established trend line is often one of the earliest warnings that a trend might be losing steam or reversing. But just like with support and resistance, don't jump the gun. Always wait for extra confirmation, like a strong candlestick pattern, before acting on a trend line break alone.

Once you get comfortable with these simple drawing tools, you can define potential entry and exit points with far more confidence. For instance, a bullish engulfing pattern that forms right on a major support level is a much stronger signal than one just floating in the middle of a chart. This is how you start layering your analysis to build a truly robust trading strategy.

Putting It All Together: A Real-World Chart Analysis

Theory is great, but the real test is applying it to a live chart. Let's walk through a complete analysis to see how these concepts layer together to build a trading story. This is the practical process of reading a forex chart to create a clear, actionable plan.

We'll use a recent daily chart of the EUR/USD pair for this exercise. The goal is to show you how to combine trend analysis, key price levels, candlestick patterns, and a couple of simple indicators to form a solid trading idea.

Here’s a look at a typical trading platform, something like MetaTrader, where all this analysis comes to life.

Image

This is our sandbox. On a platform like this, we can pull up historical data, draw our lines, and apply indicators to figure out what the market is telling us. It’s an incredible advantage we have today that traders of the past could only dream of.

Starting with the Big Picture

First things first, always zoom out to get your bearings and identify the primary trend. Looking at this daily chart, it's immediately obvious that we're in a downtrend, marked by a series of lower highs and lower lows.

To make this crystal clear, I'll draw a diagonal trend line connecting the recent swing highs. This line now serves as our dynamic resistance, a visual reminder of the downward pressure.

Next up, I'm hunting for major horizontal support and resistance zones. I see a key support level right away—price has bounced off this area twice before, creating a very clear price floor. This zone is critical; a clean break below it could signal the downtrend is ready for its next leg down, but a strong bounce might hint at a reversal.

With this basic "map" of the market structure in place, we can now zoom in and start looking for more specific clues.

Pinpointing Entries with Candlesticks and Indicators

So, we know the context: a downtrend approaching a major support level. Now, we watch the price action for tells. As the price nears our support zone, I notice that the bearish (red) candles are getting smaller and showing longer lower wicks. This suggests the sellers might be running out of steam.

To get more confirmation, I'll add two of my favorite indicators:

  1. A 20-period Exponential Moving Average (EMA) to give me a sense of the short-term trend.
  2. The Relative Strength Index (RSI) to check the underlying momentum.

Just as price taps our support level, a huge Bullish Engulfing candle forms. That's a powerful reversal signal you can't ignore. At the exact same time, I glance down at the RSI and see it's climbing out of "oversold" territory (below 30).

This is what we call confluence. We have a strong candlestick pattern at a key support level, backed up by a momentum shift on the RSI. This combination builds a solid case for a potential long (buy) trade.

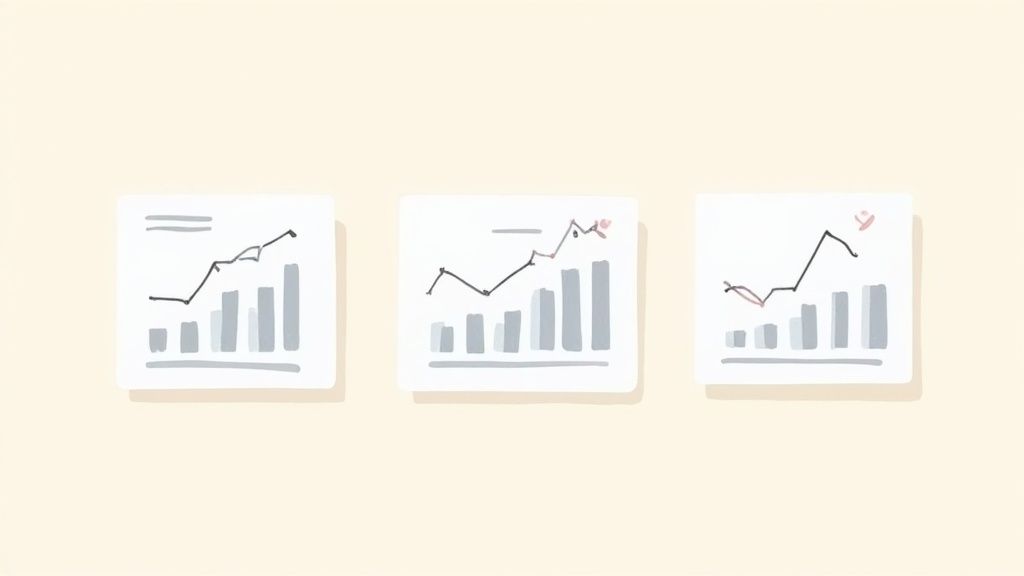
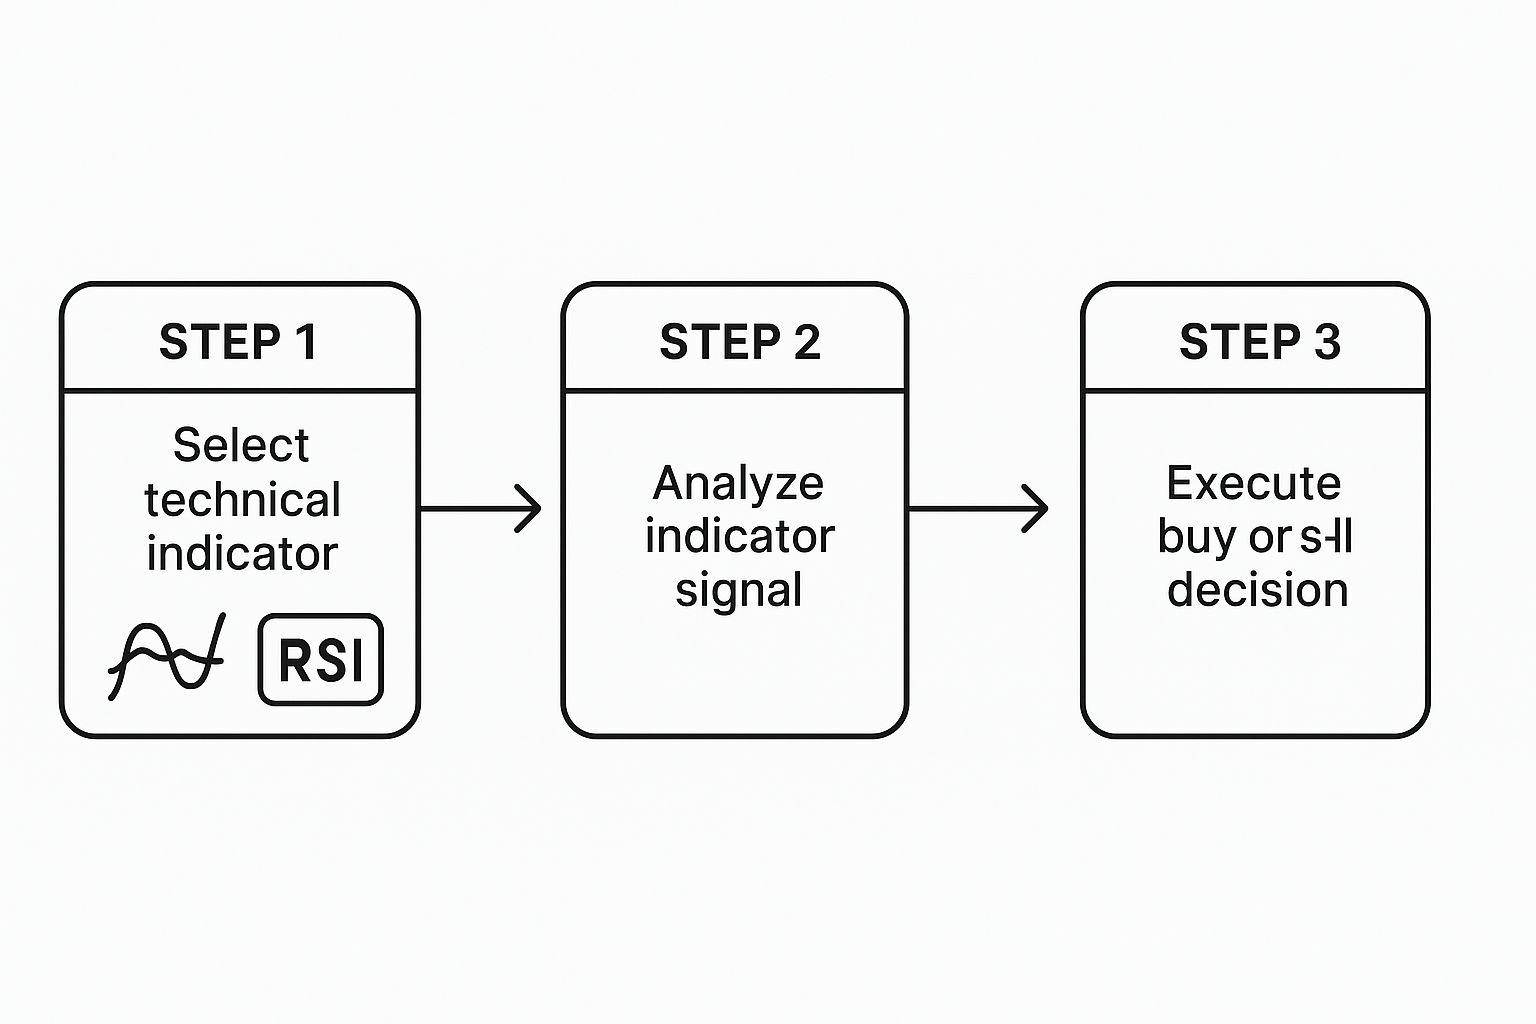
Here's the simple three-step process for how a trader might integrate an indicator into their decision-making.

Image

It’s a straightforward flow: pick your tool, analyze its signal, and use that insight to execute a trade. You're turning data into a decisive action.

Building the Complete Trading Plan

The final piece of the puzzle is defining the trade itself. Based on this analysis, a good potential entry point would be just above the high of that Bullish Engulfing candle, waiting for confirmation that buyers are in control.

But an entry is useless without proper risk management:

  • Stop-Loss: I'd place my stop-loss order just below the low of that support zone. This is my safety net. If I'm wrong and the downtrend continues, my capital is protected from a catastrophic loss.
  • Take-Profit: A logical first target would be that descending trend line we drew earlier. It's a high-probability spot for sellers to step back in, making it a great place to take some or all of the profit off the table.

By combining these different layers of analysis, we've moved from simply staring at a chart to building a complete trading narrative. We identified the overall trend, pinpointed a critical decision zone, waited for a specific price action signal, and confirmed it with an indicator. This is how you systematically turn chart data into a high-probability trading plan.

It's worth remembering that the ease with which we can access this historical data is a game-changer. Platforms like MetaTrader 4 and 5 have made professional-grade charting available to everyone. We can analyze everything from candlestick patterns to volatility shifts across different market cycles—something that was impossible before the digital age.

These charts aren't just squiggles; they reflect the dynamic interplay of trillions of dollars moving daily, a fact confirmed by institutions like the Federal Reserve Bank. You can even check out the reported daily volumes from the New York Fed. This makes historical chart data one of the most indispensable tools a trader has.

A Few Common Questions From The Trading Floor

Even after you get the hang of the basics, reading charts in real-time brings up new questions. It's totally normal. Let's walk through some of the most common things that trip up new traders so you can tackle them with confidence.

What’s the Best Time Frame to Use?

This is the million-dollar question! The honest answer is that there isn't one. The "best" time frame is the one that fits your trading style and personality.

It all comes down to how long you plan on being in a trade.

  • Are you a day trader? You're likely living on the 5-minute and 15-minute charts, hunting for quick intraday moves.
  • More of a swing trader? You'll probably feel more at home on the 4-hour and daily charts, where you can catch those bigger, multi-day swings.

Actionable Tip: Get comfortable with multi-timeframe analysis. Always start by looking at the daily chart to understand the main trend. Then, drill down to a 1-hour or 4-hour chart to pinpoint your exact entry. It’s like using a map to find the city, then GPS to find the street.

How Many Indicators Should I Clutter My Chart With?

It's easy to fall into this trap. You discover a new indicator and think, "This is it!" Before you know it, your chart looks like a bowl of spaghetti, and you're paralyzed by conflicting signals.

Trust us on this: less is more. Your goal is a clean chart that provides clear signals, not one that whispers a dozen different suggestions.

A solid, clean setup to start with might just be two or three indicators that work well together. For instance:

  1. A trend indicator like a Moving Average to tell you which way the river is flowing.
  2. A momentum indicator like the RSI to tell you how fast it's flowing.

This combination gives you a great balance of information without creating a confusing mess. You can always add more later, but start clean.

Can I Learn This Stuff Without Losing Real Money?

Not only can you, but you absolutely should. Jumping in with real money before you're ready is the fastest way to blow up your account.

Every decent forex broker out there offers a free demo account. Think of it as a flight simulator for traders. It's loaded with virtual money but uses real, live market data.

This is your sandbox. It’s the perfect place to practice reading charts, drawing lines, testing indicators, and getting a feel for placing trades—all without the stress of losing your hard-earned cash.

Treat your demo trading seriously, as if the money were real. Practice until you feel confident and are consistently spotting good trades. Only then should you even think about putting real capital on the line.


Ready to move from theory to action? At Agfin Ltd, our mission is to make this click for you. Our platform, Finance Illustrated, has a free 60-minute Forex course, fun quizzes, and the risk-free trading simulators we just mentioned. It’s the best way to build your skills before you ever risk a dime. Start your learning journey with us today.