


Ever wonder how a company like Tesla or Nike gets a price tag worth billions? It all comes down to a simple idea called market capitalization, or 'market cap' for short. Think of it as the stock market's real-time vote on a company's total worth.
What Is Market Capitalization, Really?
Imagine a company is a giant pizza, cut into millions of tiny slices. Each slice is a single share of the company's stock. Market cap is just the total cost to buy up every single slice at its current price.
It’s the big, flashy number you hear on the news that tells you a company's total value, at least according to what investors think it's worth right now.
Let's get one thing straight: market cap isn't about how many buildings a company owns or how much cash it has. It's a living, breathing number that changes every second the stock market is open. If the share price goes up, the market cap follows. If it drops, so does the market cap.
A Look at the Big Picture
This concept is huge – literally. When you add up the market cap of all publicly traded companies, the figure is mind-blowing. Recently, the global market cap was around $114.46 trillion USD. To put that in perspective, if you spent $1 million every day, it would take you over 300,000 years to spend that much! You can read more about these global market trends to see the full scale.
So what does this giant number mean for you?
Knowing a company's market cap helps you understand its size and where it might fit into your personal investment strategy. As the legendary investor Peter Lynch famously said, "Know what you own, and know why you own it." Getting a handle on market cap is your first step.
Market capitalization is the simplest way to gauge a company's size from an investor's point of view. It lets you quickly sort the giants from the up-and-comers.
To bring back the pizza analogy one last time: market cap tells you the value of the entire pizza, not just one slice. This is the core idea you need before we dive into the numbers and what they mean for your financial journey.
The Simple Math Behind Market Cap
You don't need to be a math whiz to figure out market capitalization. The calculation is surprisingly simple. There's no complex algebra, just one basic multiplication that gets you started.
The formula is as easy as it gets:
Market Cap = Current Share Price × Total Number of Outstanding Shares
That’s it! The “Current Share Price” is what one share costs on the stock market right now. The “Total Number of Outstanding Shares” represents all the slices of the company's "pizza" owned by investors, from huge funds to regular people like you.
How to Calculate Market Cap in the Real World
Let's try this with a company everyone knows: Apple. Actually doing the math yourself is the best way to make the concept stick.
Here’s how you’d do it, using some recent numbers for Apple (ticker symbol: AAPL):
- Find the Current Share Price: A quick search shows Apple's stock is trading at, let's say, $210 per share.
- Find the Outstanding Shares: Next, you find out Apple has about 15.3 billion shares out there. This is public info you can easily find online.
- Do the Math: Now, you just multiply those two numbers.
The calculation looks like this: $210 (Share Price) × 15,300,000,000 (Shares) = $3.21 trillion.
And just like that, you’ve calculated Apple’s market cap! This simple equation is how analysts and investors get those massive valuations. You can do this for any public company, from your favorite gaming brand to the tech giant that made your phone. It's the first step to understanding the true scale of a business.
How Market Cap Sorts Companies by Size
Ever wonder how Wall Street makes sense of thousands of companies? One of the simplest yet most powerful tools is market capitalization. Think of it like a boxing league. Market cap sorts companies into different weight classes, giving investors a quick snapshot of the kind of "fighter" they're looking at.
This isn't just a label – it's a crucial first look. It gives you immediate clues about a company's stability, growth potential, and risk. It's one of the first things experienced investors check.
The Three Main Weight Classes
Just like in boxing, each category has its own vibe. The biggest companies are the heavyweight champions – powerful and established. The smallest are more like scrappy up-and-comers, full of potential but also riskier.
- Large-Cap (Mega-Cap): These are the giants of the stock market, the household names everyone knows, like Apple, Microsoft, and Amazon. Valued at over $200 billion, they're known for their stability. They are the established champions. A fun fact: the first company to ever hit a $1 trillion market cap was PetroChina in 2007, but Apple was the first U.S. company to do it in 2018.
- Mid-Cap: Think of these as the rising contenders. Valued between $2 billion and $10 billion, they are established companies with proven business models but still have plenty of room to grow. Companies like Domino's Pizza or Williams-Sonoma fit in here.
- Small-Cap: These are the energetic newcomers. Usually valued under $2 billion, these companies are often younger and operate in new or niche industries. They bring higher risk but also the potential for explosive growth.
This infographic lays out the basic hierarchy of these market cap categories perfectly.
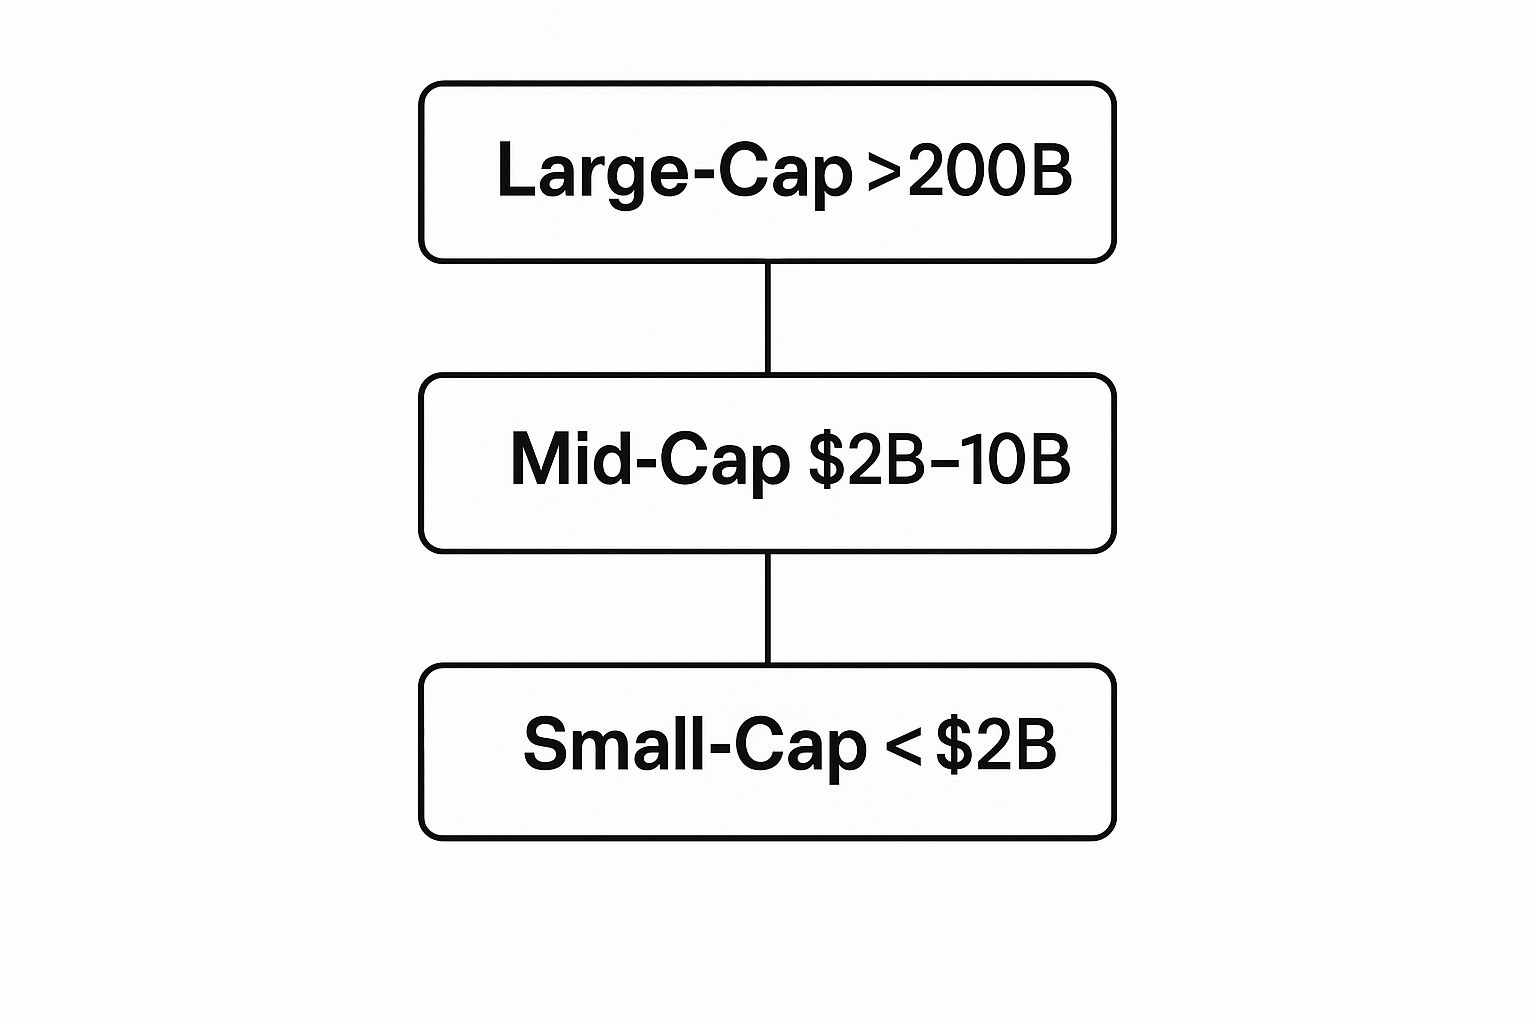
As you can see, the scale difference between a small-cap business and a large-cap titan is massive.
To help visualize the differences, here’s a quick breakdown of what you can generally expect from each category.
Market Cap Categories Compared
| Category | Typical Market Cap | Example Company | Key Trait |
|---|---|---|---|
| Large-Cap | Over $200 Billion | Apple Inc. | Stability & Dividends |
| Mid-Cap | $2 Billion – $10 Billion | Domino's Pizza | Growth Potential & Stability |
| Small-Cap | Under $2 Billion | (Varies, often emerging) | High Growth Potential & Higher Risk |
This table highlights the core trade-offs. Choosing a large-cap stock is often a bet on stability, while investing in a small-cap is a bet on the future.
Ultimately, understanding these categories helps you manage your expectations and align your investments with your personal financial goals. Each "weight class" plays a very different, but important, role in the vast world of investing.
How Legendary Investors Use Market Cap
https://www.youtube.com/embed/w5gyyx2S5Ow
For the pros, market cap isn't just a simple label – it's a powerful tool they use to take the market's temperature. Legendary investors don't just look at one company's valuation. Instead, they zoom out and use market cap to see the bigger picture, helping them decide when to be bold and when to play it safe.
One of the most famous examples comes from Warren Buffett, arguably one of the most successful investors in history. He didn't become a multi-billionaire by accident. He relies on a clever, big-picture metric that uses market capitalization to guide his major investment decisions.
The Famous Buffett Indicator
Buffett popularized a simple yet powerful concept now known as the "Buffett Indicator." It's a reality check for the entire stock market.
The indicator compares a country's total stock market capitalization to its economic output, or Gross Domestic Product (GDP). This helps answer a crucial question: Is the market getting overheated and expensive, or is it trading at a reasonable level?
This 30,000-foot view tells investors if stock prices are running way ahead of the actual economy. The Buffett Indicator essentially divides a country's total market cap by its GDP to get a ratio. In the United States, the Wilshire 5000 index is often used to represent the total market cap, since it includes thousands of U.S.-based companies.
"The price is what you pay. The value is what you get." – Warren Buffett
This classic Buffett quote perfectly captures the spirit of the indicator. It encourages investors to look past the day-to-day noise and focus on the fundamental value of the market as a whole.
This kind of analysis shows that market cap is so much more than one company's price tag; it can be a vital sign for the health of an entire economy. Professionals take this even further, using market trends for forecasting and planning. Many rely on specialized finance FPA data analysis tools for forecasting and scenario planning to make informed decisions.
By understanding how the best in the business use this metric, you can start to think like a pro yourself.
A Global View of Market Capitalization
Market capitalization does more than just tell you a company's size; it paints a fascinating picture of economic power on a global scale. Think of it as the world's economic scoreboard.
For a long time, the stock market game was dominated by just two heavyweights: first the United Kingdom, and then, decisively, the United States.
That trend has only accelerated. The U.S. market has grown so massive that its total value now makes up roughly half of the entire world's market capitalization. It's a staggering figure. For over 250 years, global market dominance has largely belonged to these two countries. You can dig deeper into this history and the dominance of the Anglo countries on finaeon.com.
The Shifting Balance of Power
But the story is always changing. The rise of China's market, especially since the 2000s, has been incredible. It has shot up the ranks to become a major player, showing just how fast economic tides can turn. And let's not forget other giants like Japan, which also plays a crucial role in the global financial arena.
This dynamic view helps you see the stock market not as a static list of companies, but as a live arena. It's a place where countries compete, economies shift, and new leaders emerge over time.
"The stock market is a device for transferring money from the impatient to the patient." – Warren Buffett
This timeless quote from Warren Buffett reminds us that market leadership can, and does, shift with long-term trends. Understanding the global market cap landscape is key to seeing these larger movements.
It helps you diversify your portfolio and make smarter choices, whether you're picking individual stocks or deciding between different ways to invest. If you're weighing your options, you can explore our guide on ETFs vs. mutual funds to learn more.
Ultimately, market cap is the scoreboard for the world economy, and the game is always on.
Putting Market Cap to Work for You
Alright, so what does this all actually mean for you, the investor?
Think of market cap as your starting block, not the finish line. It’s the first piece of the puzzle that gives you context before you start digging deeper.
A massive market cap doesn't automatically scream "great buy," just like a tiny one doesn't mean "bad bet." It's purely a measure of size. Taylor Swift has a colossal global brand, but that doesn't guarantee her next album will be a chart-topper – it just means a lot of people are paying attention. Market cap is the same deal.
Market cap tells you how big a company is, not how good it is. It’s a tool that helps you ask the right questions, not a crystal ball that spits out all the answers.
A Quick Checklist for Getting Started
As you begin to explore stocks, keep these simple ideas in your back pocket. This isn't about a secret formula; it's about building smart habits from day one.
- Size vs. Story: What does the market cap tell you about the company's scale? Now, does its story – its growth potential, industry, and products – actually justify that size?
- Context is Everything: How does this company stack up against its direct competitors? Is it a giant in a small niche, or a small fish trying to survive in a huge pond?
- Does It Fit Your Portfolio? How would a company of this size fit into your broader investment strategy? If you're building a balanced approach, check out our guide on how to diversify an investment portfolio.
Using market cap as your initial filter helps you move forward with more confidence, making smarter, more informed decisions on your investment journey.
Answering Your Market Cap Questions
Let's clear the air and tackle some of the most common questions about market capitalization. Think of this as a quick FAQ to connect the dots and clear up any confusion.
Does a High Market Cap Mean It's a "Good" Company?
Not necessarily. A high market cap tells you one thing: the company is big and likely a household name. But that’s it. It’s not a guarantee of future growth, nor does it mean the stock is a smart buy right now.
Think of it like a Hollywood blockbuster. A massive budget and A-list stars don't automatically make it a great film. Sometimes, the small indie flick (your small-cap stock) is the one that wins all the awards and delivers surprising returns.
Market cap is your starting point for research, never the final answer. It gives you context on size, but you still have to dig into the company’s financial health and growth potential.
Market Cap vs. Enterprise Value
This one trips people up, but the difference is actually pretty simple. Market cap is just the total value of a company’s stock. Enterprise value gives you a fuller picture by including debt and subtracting cash.
Let's use a housing analogy:
- Market Cap: This is like the sticker price of the house.
- Enterprise Value: This is the sticker price, plus the mortgage you have to take over, minus any cash you find stashed under the floorboards. It's the true cost to own the whole thing.
Does Market Cap Change Every Day?
Absolutely. In fact, it changes every second the stock market is open.
Because market cap is calculated using the live stock price, it’s constantly moving as investors buy and sell shares throughout the day. A company’s valuation can easily swing by billions of dollars in a single trading session.
Ready to put this knowledge into practice without risking a dime? Head over to financeillustrated.com to check out our free trading simulators and fun, bite-sized lessons. Start learning on financeillustrated.com today