

A share is a small ownership stake in a company. The book connects that idea to stock charts and company financial reports.
What will you find inside?
- How the stock market works: shares, company ownership and the difference between trading and investing.
- Reading stock charts: visual introductions to charts and price movements.
- Why prices change: company news, competition, analyst views, economic events and investor sentiment.
- Investing approaches: growth, dividend, value, quality and small-cap investing, with examples to compare.
- Company research: the main parts of a balance sheet and an earnings report.
- Your first stock research checklist: business strength, competition and growth prospects.
- A portfolio view: diversification across companies, sectors and geography.
The book is for complete beginners, including readers moving from Forex or crypto to shares. Use its company examples to connect a business with its financial figures.
Practise the book’s quote mechanics
An invented stock quote is bid $24.90 and ask $25.10. You buy 10 shares at the ask and immediately sell them at the unchanged bid. Ignore all other charges. What is the loss?
Answer and explanation
2 USD
10 × ($25.10 − $24.90) = $2.
Your answers stay on this page.
Start with three small questions
- What would I own? Describe a share in one sentence, then distinguish it from a contract linked to a share price.
- What does the business do? Pick a company mentioned in the book and find its latest annual report. Locate revenue, profit and cash flow.
- What changes the result? Try the worked example below and see what happens when you include fees.
A worked example with both outcomes
Suppose you buy 10 shares at USD 20, using cash rather than borrowing. The share cost is USD 200. Assume a USD 2 buying commission and USD 2 selling commission. These are invented teaching figures, not a provider's current prices.
| Sale price | Gross proceeds | Result after stated commissions |
|---|---|---|
| USD 22 | USD 220 | 220 − 200 − 2 − 2 = USD 16 |
| USD 18 | USD 180 | 180 − 200 − 2 − 2 = −USD 24 |
The example excludes taxes, dividends and foreign-exchange conversion. It therefore does not describe the final result for every reader.
What sale price would cover the share cost and these commissions?
USD 20.40 per share: 10 × 20.40 = USD 204, covering USD 200 plus USD 4 of commissions. This is a break-even calculation under the stated assumptions, not a target price.
Open the book at the chapter you need
Choose the chapter that answers your question. Page numbers include the cover.
Pages 6–10: connect a share to a real business
The market illustration introduces companies, shares and investors. The next pages discuss price changes, dividends and the difference between trading and investing. As you read, write two separate sentences: “The business earns money by…” and “A shareholder’s result depends on…”. That small separation helps you avoid treating a familiar product as an automatic reason to buy its maker. For the basic ownership definition, see the US SEC’s Investor.gov explanation of stocks.
Pages 11–20: read a picture, then ask a better question
The chart chapter leads into company news, competition, analyst opinions and investor sentiment. The book then introduces a stock index and investing styles. Try matching each example to a research question. A growth approach asks what could expand; a dividend approach asks about distributions; a value approach asks what assumptions justify today’s price. These are ways to organise research, rather than answers about which share to buy.
Pages 21–29: investigate the company and the portfolio
The balance-sheet and earnings chapters introduce cash, debt, shares outstanding and earnings per share. Later pages turn to understanding a business, its leadership and its growth prospects, then diversification. Keep a notebook alongside these chapters. Write the report date beside every number and the source beside every claim. The goal is a short explanation you can check, not a page of ratios you cannot explain.
Download the free illustrated stock trading PDF
A stock chart and a company report answer different questions
A chart helps you describe price behaviour over a chosen period. A company report helps you investigate the business behind that price. Use both without expecting either to supply a certain next move.
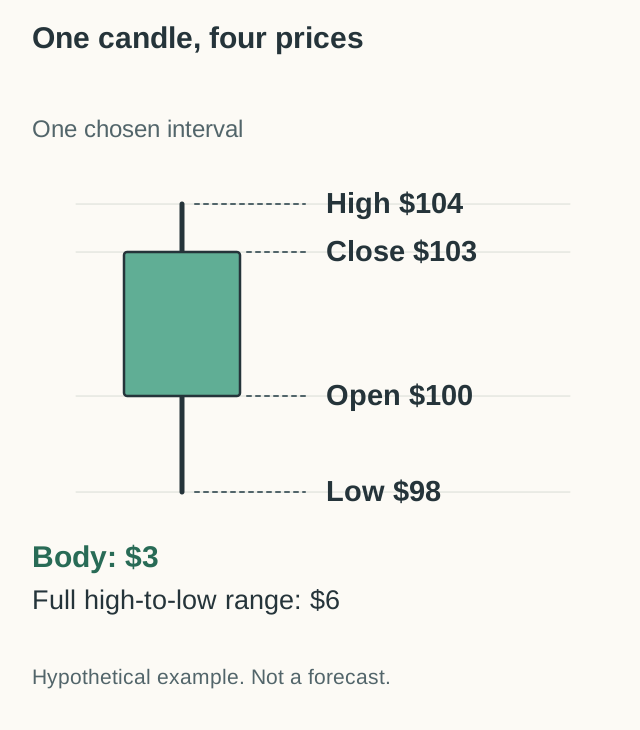
Read the illustrated candle aloud: open 100, high 104, low 98, close 103. Its close is 3 above its open; its full range is 6. Now ask what is missing. You have no company sales figures, no explanation of the move and no complete sequence of trades. Changing the chart interval also changes what each candle summarises. This is a reading exercise, not a buy signal. CME Group’s chart lesson explains the four-price format.
For the report side, begin with three headings: the balance sheet shows assets and obligations at a date; the income statement covers revenue and expenses over a period; the cash-flow statement tracks cash movements. The US SEC’s beginner guide to financial statements explains those distinctions.
Here is a fictional business exercise. A shop reports sales of USD 1,000 and total expenses of USD 900, giving profit of USD 100 under these simplified assumptions. Suppose customers have not yet paid USD 150 of those sales. “Profitable” alone does not tell you how much cash arrived. Ask about payment timing and read the cash-flow statement before telling the story. No accounting background is needed to spot the missing question.
Pause and think. Which question is answered by a price chart, and which by a company report?
Compare your reasoning
A chart records market-price observations over time. A company report supplies information about the business and its finances. One does not replace the other’s evidence.
One low-priced share can belong to a larger company
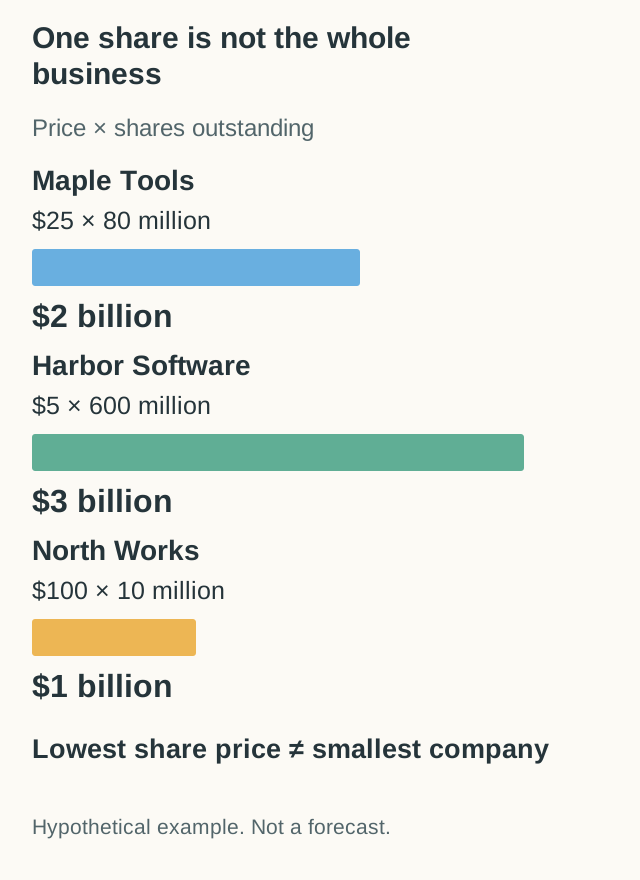
Harbor’s USD 5 share looks cheaper than Maple’s USD 25 share. But Harbor has 600 million shares in this example, while Maple has 80 million. Multiplying produces USD 3 billion and USD 2 billion respectively. That calculation is market capitalisation. It does not establish which company offers better value. To make that judgement you still need to examine the business, its finances and the assumptions behind the price.
Try this part
Price, size and business are different
Match the measure to what it can describe.
- Share price
- The price of one share, rather than the value of all shares.
- Market capitalization
- Share price multiplied by the relevant shares outstanding.
- Cash flow
- Cash generated or used over a defined reporting period.
Keep these book terms in your own words
- Share: a unit of ownership in a company.
- Dividend: a distribution to shareholders when the company makes one; do not assume every share pays one.
- Capital gain or loss: the difference between a sale price and purchase price before you account for other relevant costs.
- Revenue: sales before expenses are deducted. It is different from profit.
- Portfolio: your collection of investments. Ask what risks they share, as well as how many names appear.
Questions readers ask before downloading
Is this a stock book or a general trading book?
Its main subject is shares: how the stock market works, charts, investing approaches, company accounts and portfolios. There are references to other trading products, but this is the stock-market volume. Choose it when you want an illustrated introduction to company ownership and stock research.
Do I need to open an account to follow the lessons?
You can read the PDF, work through the arithmetic and build a fictional research notebook without a trading account. A useful first task is to explain a company’s business and locate its published report. Decide what you want to learn before choosing any tool.
Should I copy the companies used as examples?
Use the named companies to practise asking questions. An example in a book is not a current recommendation or a portfolio allocation. Try researching a different company with the same checklist so that you learn the method rather than memorising a name.
Can I use it to choose between trading and investing?
The comparison chapter gives you vocabulary for that decision. Add your own time horizon, available study time and reason for participating. Write down whether you are investigating a business over years or a shorter price move. A clear purpose makes the later chapters easier to use.
What should I be able to do after reading?
Explain what a share represents, describe a chart without making a forecast, distinguish revenue from profit, and ask useful questions about a company and a portfolio. Those are practical first milestones. You can return to the book whenever one of those explanations feels unclear.
A quick self-check before the next lesson
Close the PDF and describe one fictional company in five lines: what it sells, how it earns money, the period its report covers, one uncertainty and the source you would check next. Then look at the candle illustration and explain why its closing price cannot tell you the business’s profit. If you can separate those two stories, you have a useful foundation for the next chapter. If not, revisit pages 11 and 21 before moving on.
When you want to practise placing orders, compare the learning features in our stock market simulator guide. For the differences between learning tools and investing services, read our beginner stock app comparison. Choose the tool around the skill you want to practise, rather than starting with a real-money deposit.
Turn the next chapter into practice
Follow our Stocks & Investing learning path for short lessons and exercises. For virtual-money practice, explore Trading Game and keep a note of what each simulated order taught you. Practice helps you learn the process; simulated gains do not establish future returns.
Read with your book
These notes correct parts of the book. Page numbers count the cover as page 1.
4 · Retirement arithmetic
Saving 25% of annual expenses does not by itself establish that an investment portfolio can fund retirement. The statement omits accumulated capital, years of saving, returns, inflation, taxes and withdrawals. It should not be read as a proven retirement formula.
6 · New shares and existing shares
A company can raise money when it issues shares. In ordinary secondary-market trading, an investor buys existing shares from another holder; that purchase does not normally pay its proceeds to the company. The diagram combines these different transactions.
4, 5 · Platform terms and investment outcomes
The quoted $100 starting balance, $200 copying minimum, instrument counts and CFD loss percentage are old figures, so check the current terms. Copying can lose money, and owning stocks does not guarantee inflation protection or positive returns.
1, 2 · Unverified promotional claims
The cover and introduction claim millions of downloads, a ranking and personal holdings of the authors. We have not checked these claims, so read them as promotion.