
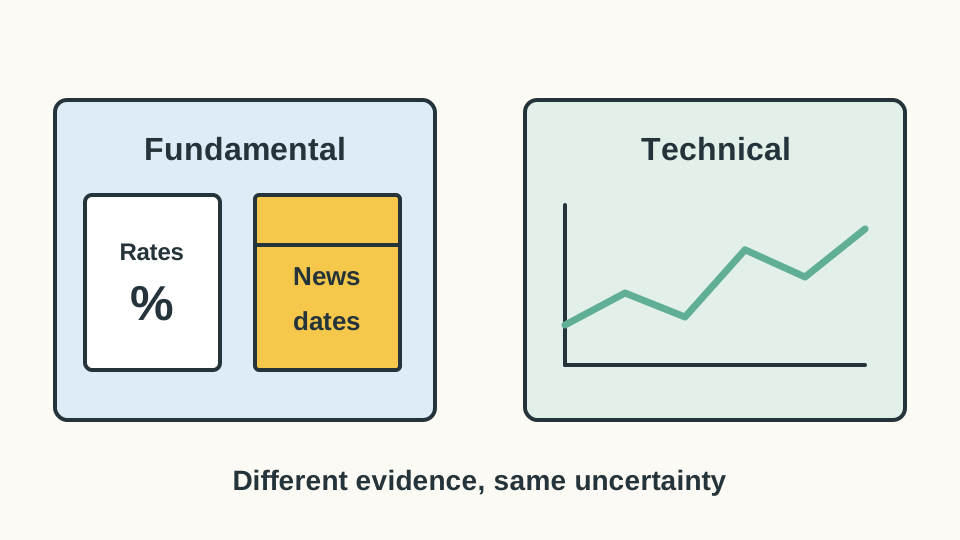
Forex
Forex Market Analysis: Fundamental vs Technical
Learn the two main kinds of forex analysis, what each can and cannot tell you, and how to turn a trading idea into a plan you can test honestly.
Head and shoulders, pin bars, breakouts, carry trades: here are 15 popular ideas in plain words. None works every time, so each comes with the way it often fails.
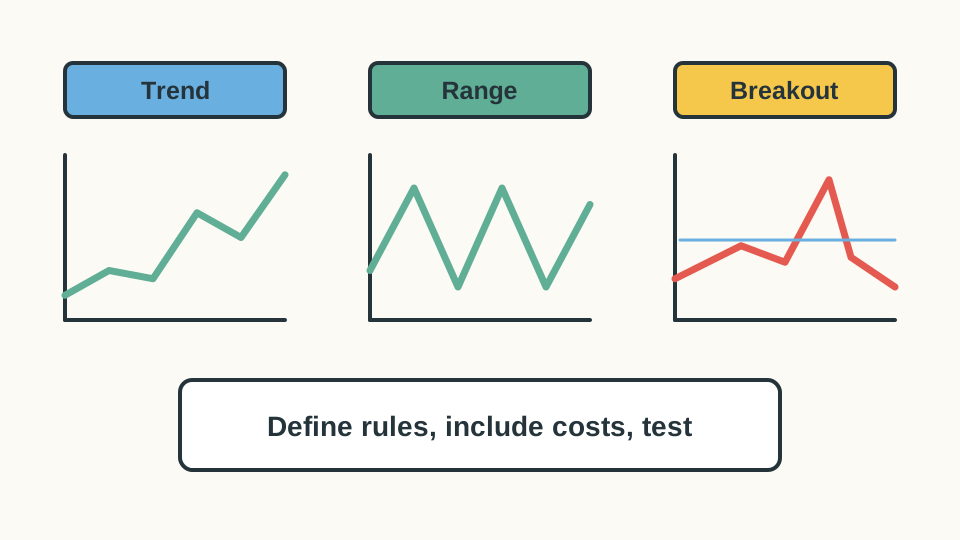
Many strategy lists mix up two things. A holding style says how long you keep a trade. A strategy says why you enter and when you get out.
Any of the 15 ideas below can be used with any style. But the style changes your costs. Short trades aim for small moves, so the spread takes a bigger share of each one. Long trades may pay overnight financing and sit through more news.
So choosing "swing trading" is only the first step. You still need rules for when to buy, when to sell and how much to risk.
Here are 15 popular ideas, from simple trend rules to classic chart patterns. Each one is a guess about what price will do next. The table shows what you must define before you can test it, and how it often fails.
| Idea | What you must define | How it often fails |
|---|---|---|
| 1. Moving average trend (golden cross) | The 2 average lengths, and when a cross counts | Many false signals when prices move sideways |
| 2. Breakout (from a channel or after a quiet spell) | The past high or low, or the size of jump that triggers a trade | Price breaks out, then quickly turns back; fills slip in fast moves |
| 3. Trend pullback (buying a dip in an uptrend) | The trend, and how deep a dip must be | The dip turns into a full reversal |
| 4. Range trading | The floor and ceiling, chosen before you trade | The range breaks while you bet against the break |
| 5. Support or resistance retest | The level, and what counts as a retest | The level gets redrawn after the fact |
| 6. | The 3 peaks, the neckline and what confirms it | The expected fall never comes |
| 7. or double bottom | How close the 2 peaks must be, and the trigger | 2 pauses get mistaken for a turn |
| 8. (inside day, double inside bar, 2 dojis) | Which bar's high and low trigger the trade | Price crosses both sides in choppy trading |
| 9. Outside bar or | Bar size, wick length and the close you need | The big bar is followed by more of the same trend |
| 10. Three in a row (three white soldiers, three black crows, double red) | How big each candle must be, and what came before | The move is already over when you enter |
| 11. Momentum | The look-back period and the size of move that triggers | You join a move just as it ends |
| 12. | The average, and how far price must move away from it | The average itself moves in a strong trend |
| 13. Session opening range | The session, time zone and first-hour window | Clock changes and thin trading distort it |
| 14. | The real financing you earn or pay, and your currency risk | An exchange-rate loss wipes out the interest |
| 15. News and events | The report, what was expected and how long you watch | The surprise is misread, or spreads jump |
This is not a ranking of the best methods. No pattern wins every time, and none comes with proof that it will make money for you. Treat each row as a question to test. For 8 of these ideas in more detail, see forex trading strategies for beginners.
Try it yourself
For each made-up chart, pick Up, Down or Not sure. Then watch what the price did and read why.
In 4 made-up examples, a head and shoulders and a pin bar at support worked. A breakout above a range and a double bottom both failed and reversed. The same kinds of shapes gave opposite results.
What would you expect?
What this shows: A finished pattern is a guess, not a promise. The same shape can work or fail, so count many cases before trusting it.
Pattern guides usually show clean examples that worked. To judge a pattern, you need every case, including the failures and the costs.
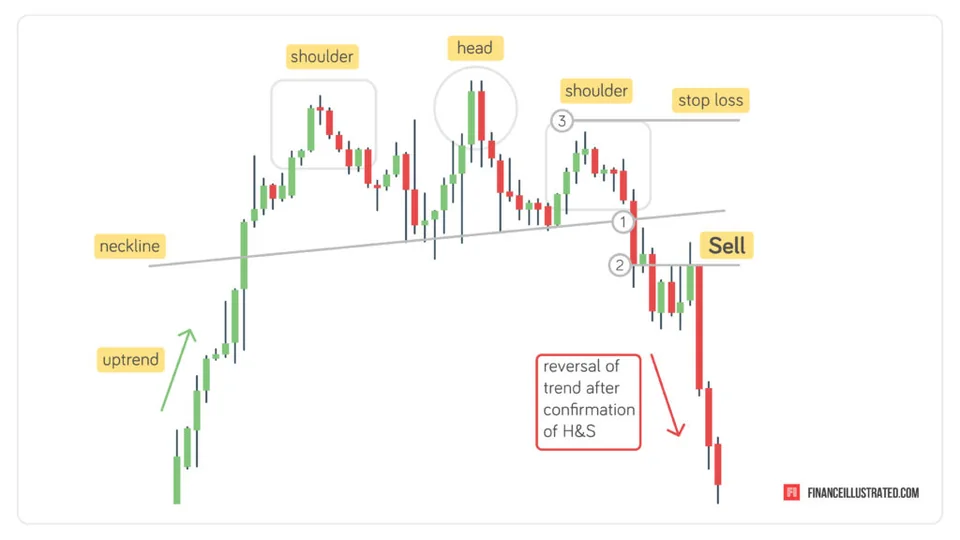
A head and shoulders has 3 peaks: a lower one, a higher one in the middle (the head), then a lower one again. A line under the dips between them is called the neckline. The idea: if price closes below the neckline, the uptrend may be over.
A double top is 2 peaks at about the same price. A double bottom is 2 dips at about the same price. Both are read as possible turning points.
Pattern pictures look tidy because they were chosen after the fact. They do not show how many similar shapes failed, or how hard the shape was to see while it was forming. CME Group's reversal pattern lesson explains the common shapes.
Support and resistance are areas, not walls (see CME on levels). Write a level down before you see what happens next. Moving it later until the chart fits spoils the test.
Candle patterns look at 1 to 3 candles at a time:
Each pattern needs exact numbers: how long the wick, how big the body, what trend came first. Only act after the candle closes. A shape that looks right halfway through the hour can be gone by the end. See how to read forex charts.
Not every idea is a chart shape:
Around big news, very fast traders act first and spreads can widen. A beginner can learn a lot just by writing a guess before a report and checking it after. No trade is needed for that.
Pick one idea, one pair and one timeframe. Write the exact rule. Then:
One more check: if price touches your stop, is your loss exactly as planned? No. In a fast move or a gap, a stop can fill at a worse price.
The backtesting lesson shows how to avoid fooling yourself. For the basics in order, follow the forex learning path. Keep practice results labelled as practice.
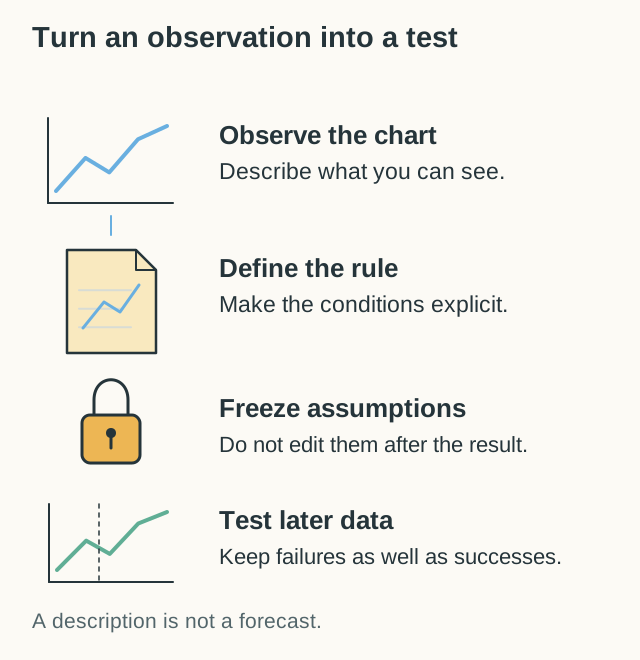
None is best for everyone. Start with one simple rule you can write in a sentence. Test it on many past cases with costs, then practise it with virtual money.
Day traders close their trades the same day. Swing traders hold for a few days to a few weeks. Neither is a full strategy: each still needs rules for when to enter and exit.
Sometimes. A pattern describes a shape that happened before. It does not promise what comes next. To judge one, define it exactly and count how often it worked, after costs.
Learn the two main kinds of forex analysis, what each can and cannot tell you, and how to turn a trading idea into a plan you can test honestly.
Learn the forex basics in plain words: currency pairs, going long or short, pips, lots, the spread, and how leverage makes a small move cost a lot.