

Stocks & investing
How to Start Investing in Stocks: A Simple First Plan
Start investing in stocks step by step: give your money a job, choose what to own, check the broker, count every cost and place a first order.
Overweight sounds like 'buy', but it usually means 'better than a benchmark'. Learn what the word really says, and how to turn an analyst headline into useful questions.

Analysts at banks and research firms publish ratings on stocks. Many use a three-step scale: , equal-weight and underweight. Overweight usually means the analyst expects the stock to do better than a , such as a stock index or a group of similar companies.
The exact meaning comes from each firm's own definitions. Morgan Stanley is one example. Its research disclosures were checked for this page in October 2026. They say an overweight stock's total return is expected to beat a benchmark over the next 12 to 18 months, allowing for risk. The benchmark is the relevant country , or the average for the stocks that the analyst's industry team covers.
The same page says its overweight, equal-weight and underweight ratings are not the same as buy, hold and sell. Other firms use other words, such as buy, outperform or sector perform. So before you translate a rating into plain words, read that firm's definition.
Yes. Overweight is a comparison. It says the stock should do better than its benchmark. It does not say the stock will go up.
Suppose an analyst expects a stock to fall 8% while its industry falls 15%. If that happens, the stock beats its benchmark by 7 . You still lose money.
| Stock return | Benchmark return | Difference | What it means for you |
|---|---|---|---|
| +12% | +7% | +5 points | You gain, and the stock beat the benchmark |
| −8% | −15% | +7 points | You lose, even though the stock beat the benchmark |
| +4% | +10% | −6 points | You gain, even though the stock lagged the benchmark |
A fair comparison needs the same dates and the same kind of return. Comparing a stock's price change with an index's total return, which includes dividends, would tilt the result. Currency moves can matter too.
So the useful question is always: better than what, and over how long? A rating that compares a stock with its industry says nothing about whether the industry itself will rise.
Try it yourself
Read each rating and what the market does next. Guess whether the stock ends the year up or down, then watch the chart.
Overweight stock: down 8% while its industry fell 15%. It beat the benchmark by 7 percentage points, but $1,000 became $920. Underweight stock: up 4% while its benchmark rose 10%. It lagged by 6 points, yet $1,000 became $1,040.
What would you expect?
What this shows: Overweight is a comparison, not a promise of gains. A stock can beat its benchmark by 7 points and still lose you money.
In the first case the stock fell 8% while its industry fell 15%. The analyst was right, and you still lost 8%. Always ask: better than what, and over how long?
Many reports also give a : the price the analyst thinks the stock could reach by a stated date, often 12 months ahead. It comes from a model built on assumptions, such as future profit, interest rates and what investors will pay for that profit.
A target can be raised, cut or simply missed. A target above today's price does not tell you how likely it is. It also says nothing about the path the price takes, or whether the risk suits you. Different analysts can publish very different targets for the same stock, which shows how much depends on their assumptions.
Read how the analyst got the number, and ask what happens if one key assumption is wrong. A firm can change a target without changing the rating, and the other way round.
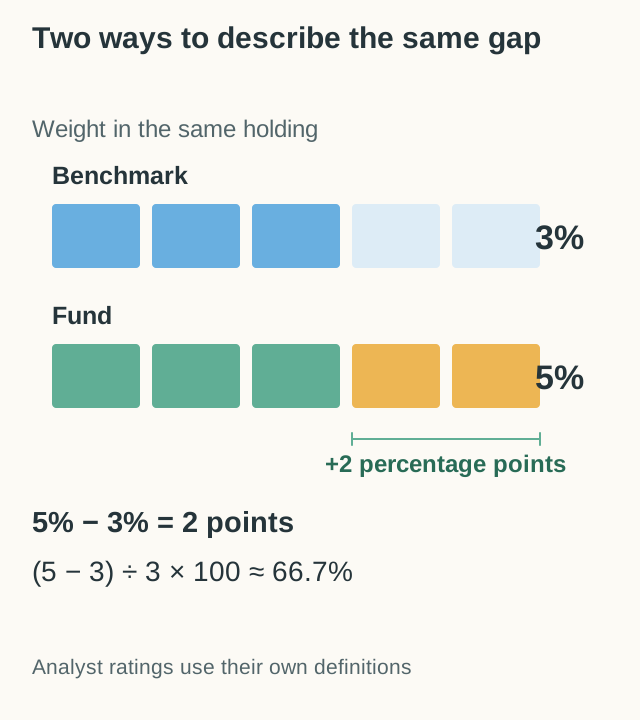
Overweight has a second meaning. It can describe a real holding. A fund is overweight a stock when it holds more of it than the benchmark does.
Watch the units. 5% is about 66.7% more than 3%, because 5 ÷ 3 − 1 ≈ 0.667. But it is only 2 percentage points higher. Use percentage points for the gap between two weights, and percent for the relative size.
You can use the same idea with your own plan. If your plan says 10% in one industry and you hold 16%, you are 6 percentage points overweight. That tells you about your exposure. It does not tell you when, or whether, to rebalance. Our buy and hold guide covers regular portfolio reviews.
Analysts often work for firms that also do banking, trading or other business with the companies they cover. That does not make a report wrong, but it belongs in your judgement. Look for the report date, the firm, its conflicts disclosure and the stock's rating history.
The SEC's guide to analyst recommendations explains why investors should check rating definitions and possible conflicts, instead of relying on labels. It is useful background, but some rule details on older pages may have changed since.
Many broker apps and financial news sites show rating summaries. Try to read the original report, or at least the firm's rating definitions. A headline may leave out the benchmark, the time frame and the risks. If the same firm also advises the company, read the report with extra care.
Treat a rating as a list of questions, not an instruction. Before you act, write down:
Check the claims in the company's filings using our research resources list. Then compare the idea with your existing holdings, cash needs and goal. An analyst's view cannot decide your position size, and agreement among analysts does not make a forecast certain.
If a stock you own is downgraded, don't panic. A downgrade is one firm's changed opinion, not an order to sell. Go back to your own reasons for owning it.
Next, see how company size is measured in market capitalization, and learn how to spread a portfolio so no single view controls it.
Not exactly. Overweight usually means a stock should beat a benchmark over a set period. Some firms, including Morgan Stanley, say their overweight rating is not the same as buy. Read each firm's own definitions.
On many scales, overweight means the stock should do better than its benchmark, equal-weight about the same, and underweight worse. The benchmark and the time frame depend on the firm that wrote the rating.
Whenever the analyst's view changes. Updates often follow a company's quarterly results or big news, such as a merger. Always check the date of the rating you are reading.
Many broker apps and financial news sites show summaries. For the full picture, look for the original report and the firm's rating definitions, which explain the benchmark and the time frame.
Start investing in stocks step by step: give your money a job, choose what to own, check the broker, count every cost and place a first order.
A fractional share lets $50 buy part of a $200 share. Learn how fractions move with the price, how dividends work and what to ask your broker first.