How to Start Investing in Stocks: A Guide for Young Investors

ye

Jumping into the stock market is a lot simpler than most people think. Seriously. To get started, you just need to open a special account, put some money in it, and pick your first investment – whether that’s a single stock or a bundle of them called an ETF.

Buying your first share is literally as easy as tapping a button on an app, and you can often get going with just $5 or $10.

Your Guide to Stock Market Investing

Young person reviewing stock charts on a tablet in a modern, sunlit room, looking confident and engaged

Ready to finally get your money working for you? When you buy a stock, you're owning a tiny piece of a company you probably already use, like Nike or Netflix. If the company does well, the value of your piece can grow with it.

First, let's bust a huge myth: you don't need a pile of cash to start. In fact, one little-known fact is that many of America's first millionaires were school teachers who started small and invested consistently over their careers. It's all about starting early and letting your money grow.

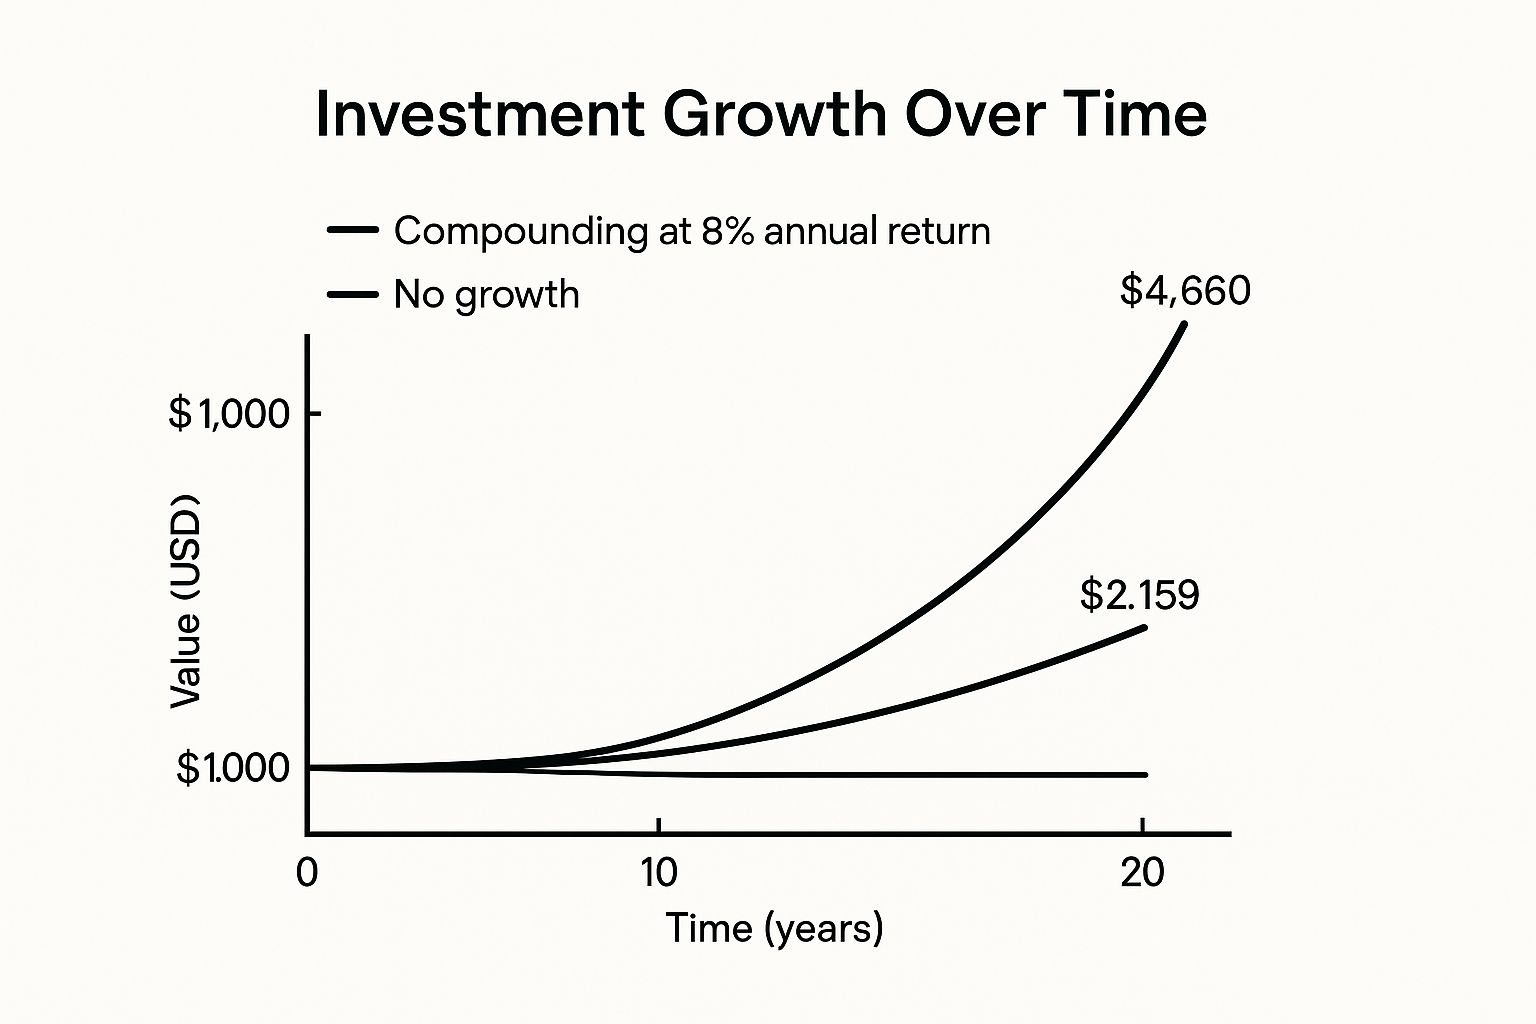
"Compound interest is the eighth wonder of the world. He who understands it, earns it; he who doesn't, pays it." – Often attributed to Albert Einstein

That quote is the secret sauce. Compounding is when your earnings start making their own earnings. It's like a small snowball rolling downhill, getting bigger and faster as it picks up more snow. Even a small start can turn into something huge over time.

Your Investing Quick Start Roadmap

Think of this guide as your roadmap. We'll walk through everything you need to know, making this feel less like a boring finance class and more like a smart, practical adventure.

Here’s a bird’s-eye view of the journey ahead.

Phase What You Do The Big Picture
Setup Open and fund a brokerage account. This is your home base for all your investments.
Selection Pick your first stocks or ETFs. You're choosing which companies you want to own a piece of.
Execution Place your first buy order. This is the exciting moment you officially become an investor.
Growth Develop long-term habits. You'll learn how to manage and grow your money over time.

By following these phases, you'll build the confidence to not just start investing, but to stick with it. This isn't about getting rich overnight; it's about making smart, steady decisions that build a strong foundation for your financial future.

Choosing the Right Brokerage Account

A diverse group of young adults looking at a brokerage app on a smartphone together, with a clean and modern user interface visible on the screen.

Before you can buy that first piece of a company, you need a place to do the buying and selling. That's a brokerage account. Think of it as a special bank account just for your investments.

Getting this first step right makes everything else so much smoother. Your choice of broker isn't a minor detail; it's your first real investing decision and the main tool you'll use to build wealth.

Find the Account That Fits You

For most beginners, the choice is between a standard brokerage account or a Roth IRA. A standard account offers the most flexibility, but a Roth IRA is a secret weapon for retirement, letting your money grow completely tax-free.

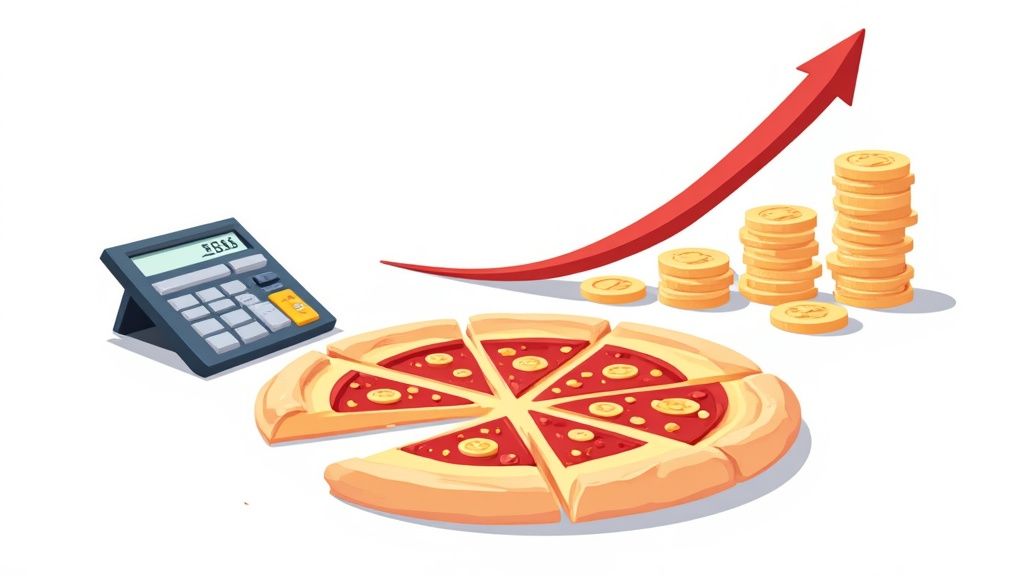
The potential here is huge. The entire global stock market is worth over $100 trillion. An interesting fact is that if you had invested just $100 in the S&P 500 (a mix of the 500 biggest US companies) back in 1980, it would be worth over $10,000 today. Modern brokerage apps have made it super easy for anyone to get a piece of that action.

Basketball legend Shaquille O'Neal said it best: "It is not about how much money you make. The question is are you educated enough to KEEP it." Choosing the right account is the first step to keeping – and growing – more of your hard-earned money.

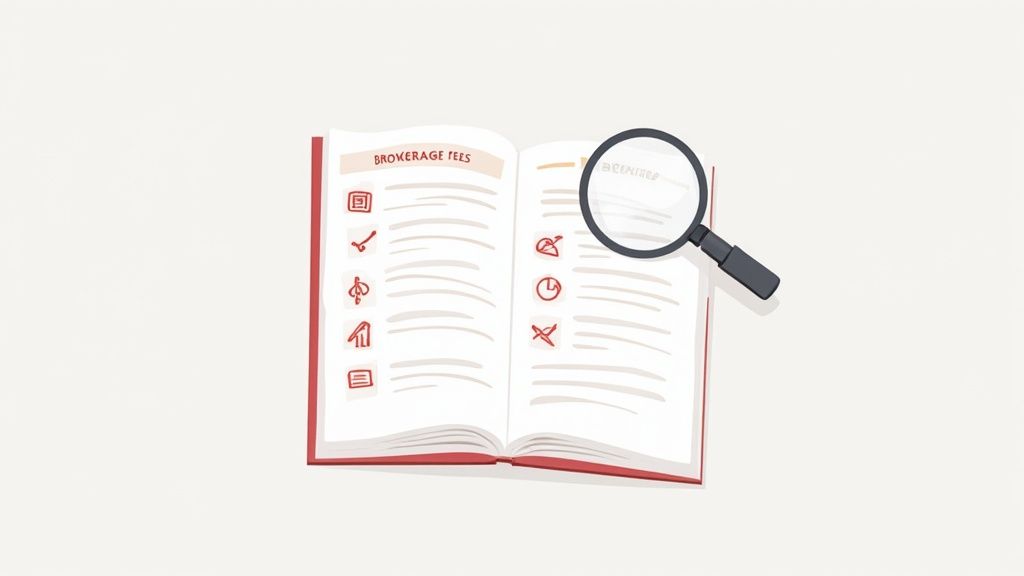
What to Look For in a Broker

When you’re looking for a broker, it's easy to get overwhelmed. Just focus on a few key things that really matter for new investors. You'll want a platform that’s easy to use, offers good learning tools, and – most importantly – has low fees. Hidden costs are the silent killers of your future earnings.

Here’s a quick checklist of must-haves:

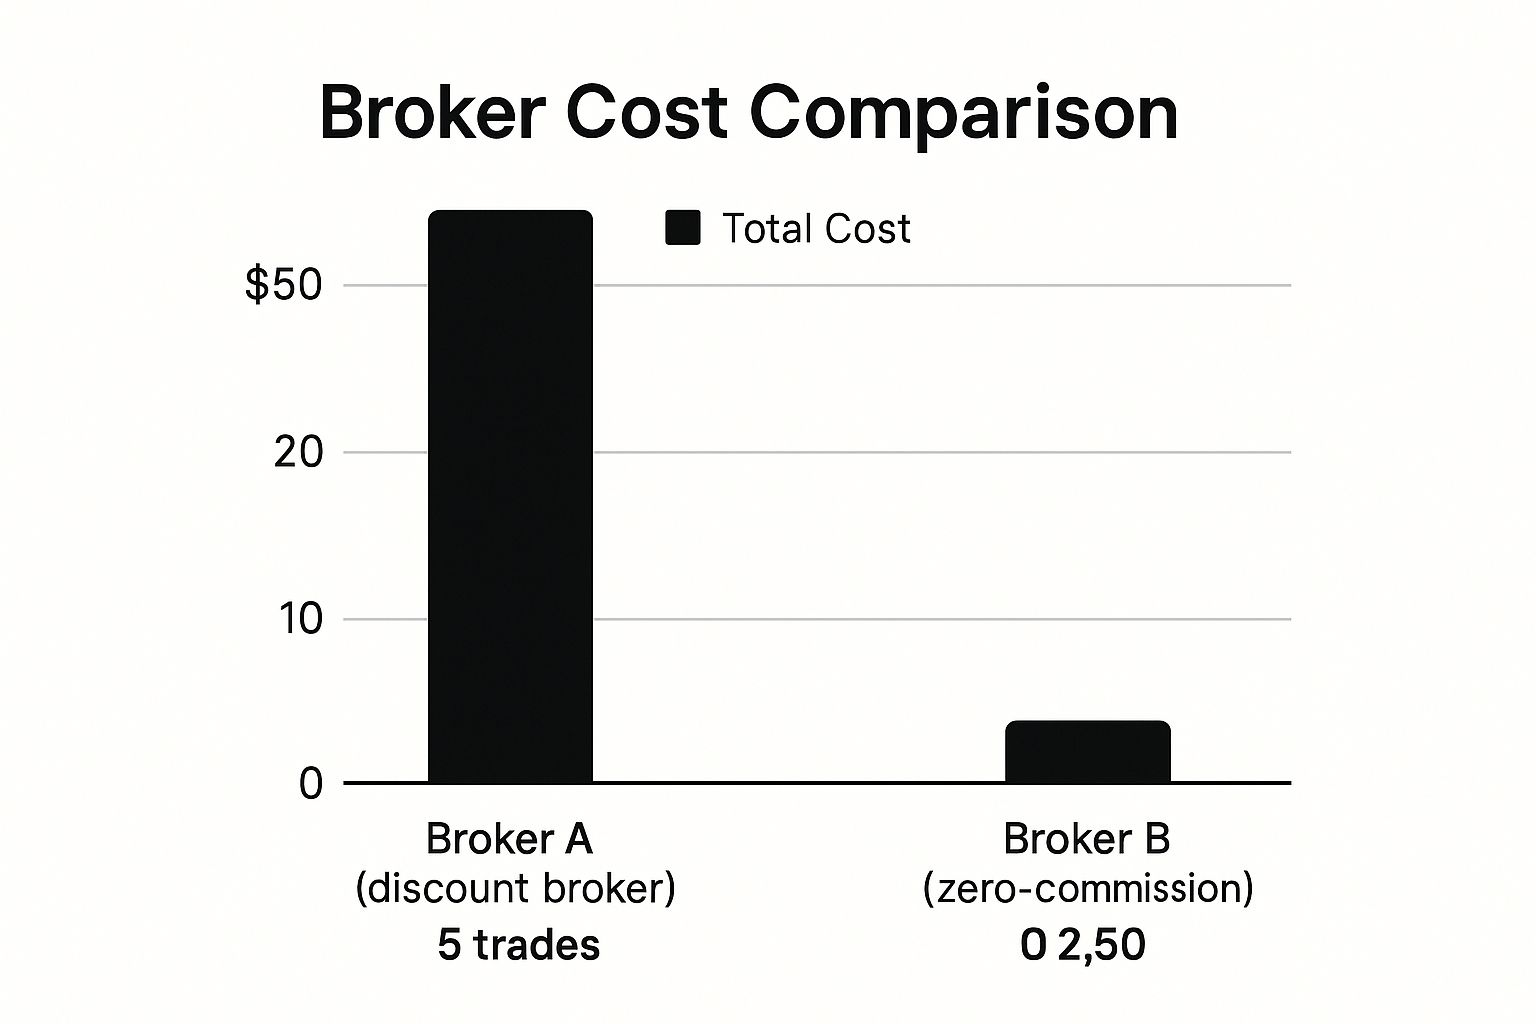
  • Low Fees: This is a big one. Many top brokers now offer $0 commission on stock trades. Don't settle for less.
  • A Great App: If the app is clunky or confusing, you're not going to use it. Find one that feels natural to you.
  • Learning Resources: The best brokers want you to succeed. They provide articles, videos, and tutorials to help you learn as you go.

Some platforms are for hyperactive day traders, while others are perfect for a more relaxed "set it and forget it" style. Don't be afraid to poke around and see which one feels right. For a much deeper dive into the costs, check out our guide on comparing brokerage fees to see how the top players stack up.

How to Pick Your First Investments

Alright, this is where the fun really begins – deciding where to put your money. With thousands of companies out there, it can feel paralyzing. So, let's cut through the noise and keep it simple.

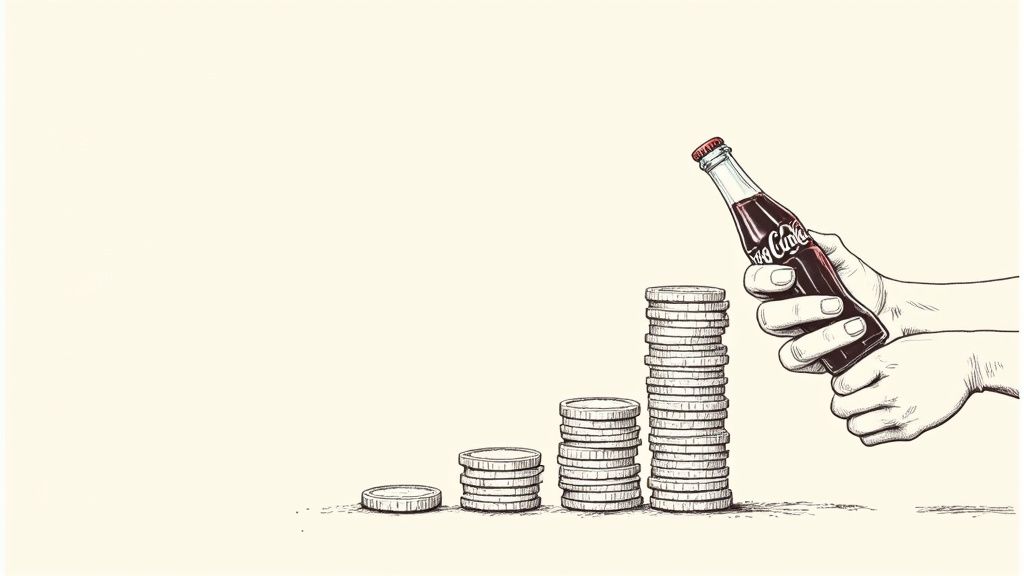
A great starting point is to invest in what you know and use every day. Seriously, look around you. Are you reading this on an iPhone? Apple (AAPL) is a stock. Did you watch a movie last night? Netflix (NFLX) is a stock. Love your sneakers? Nike (NKE) is a stock.

This isn’t just a cute trick; it’s a strategy that legendary investors use. When you're a customer, you have a natural advantage. You understand the products and can often tell when a company is doing great or falling behind.

Individual Stocks vs. ETFs

As you start jotting down company ideas, you’ll hit a fork in the road: should you buy individual stocks or go for an Exchange-Traded Fund (ETF)?

An individual stock is exactly what it sounds like – a single slice of one company. An ETF is more like a curated playlist. It holds dozens or even hundreds of different stocks all at once. For example, an S&P 500 ETF lets you own a tiny piece of the 500 largest companies in the U.S. with a single click.

For new investors, ETFs are a fantastic way to instantly spread out your risk. If one company in the "playlist" has a bad month, it’s balanced out by all the others.

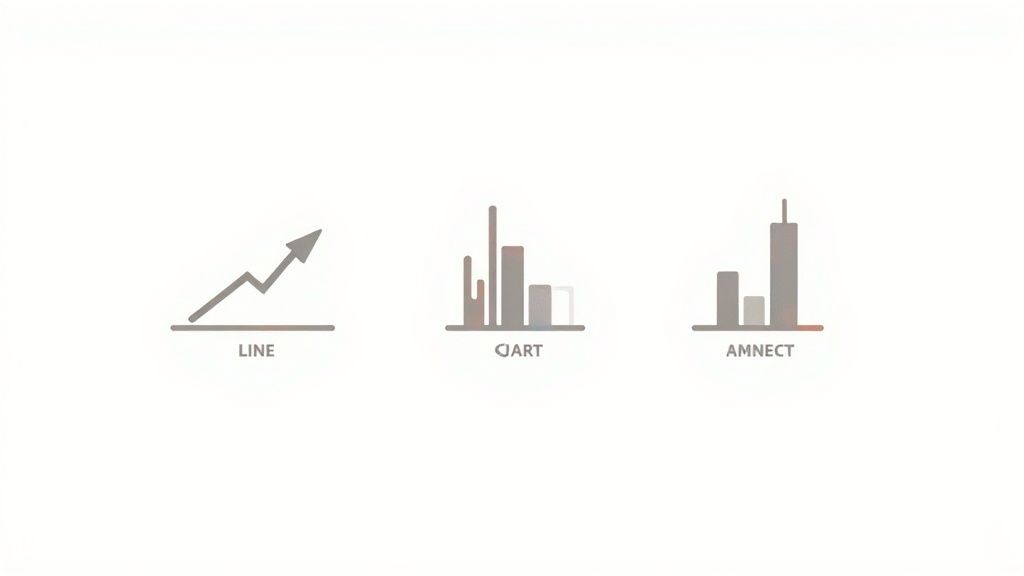
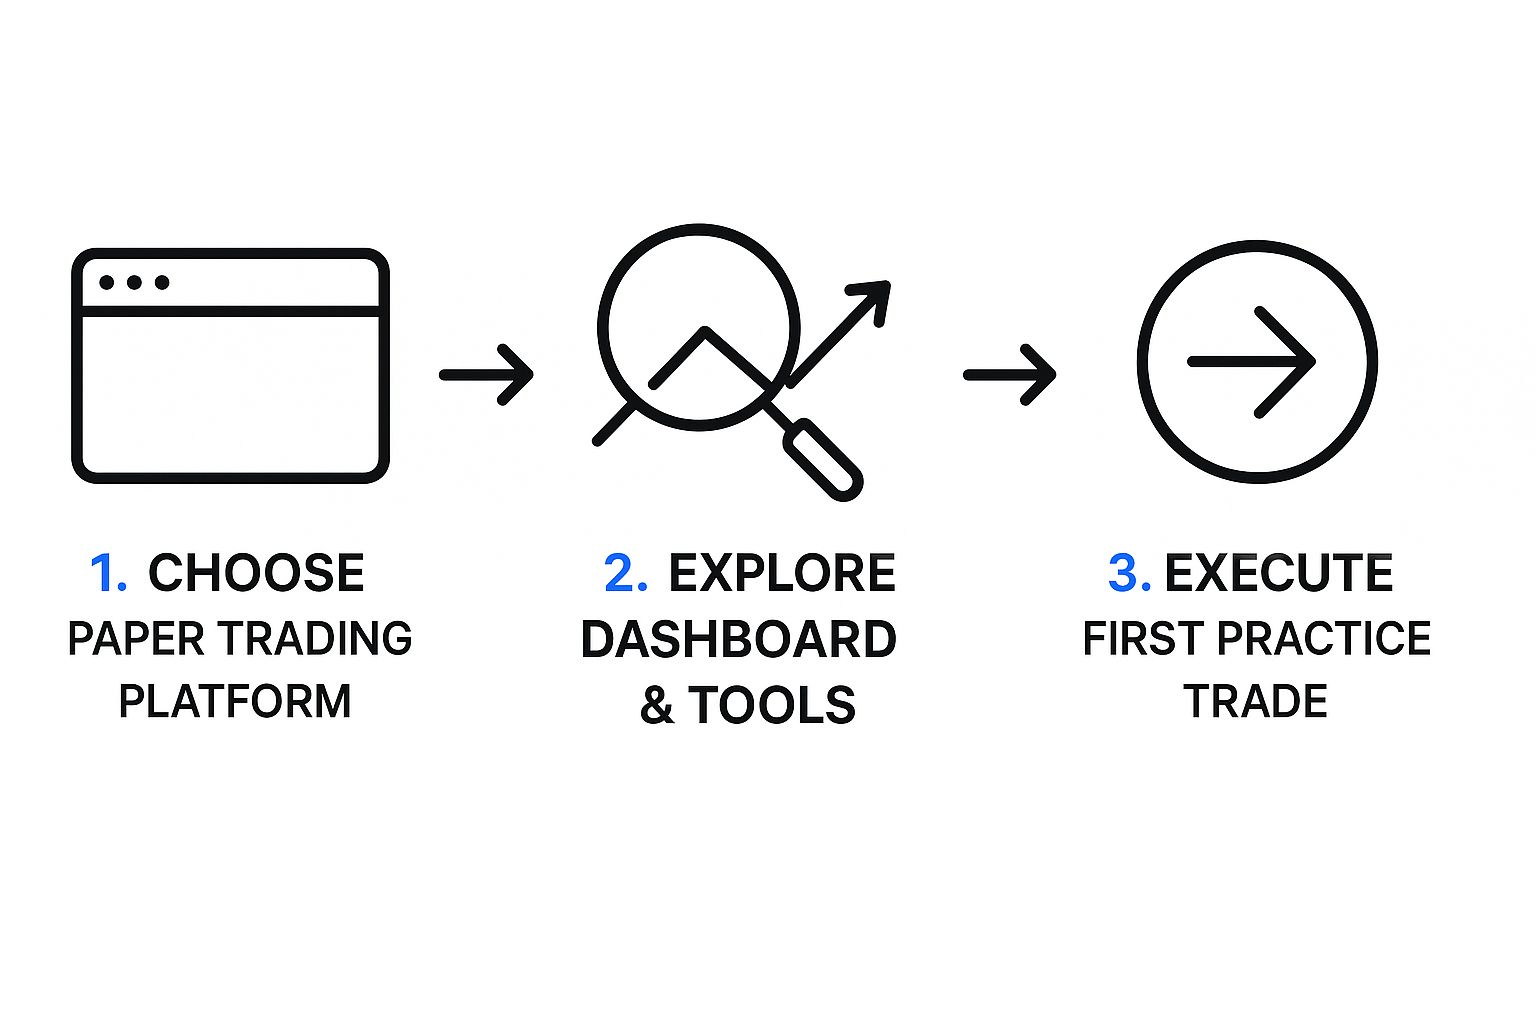
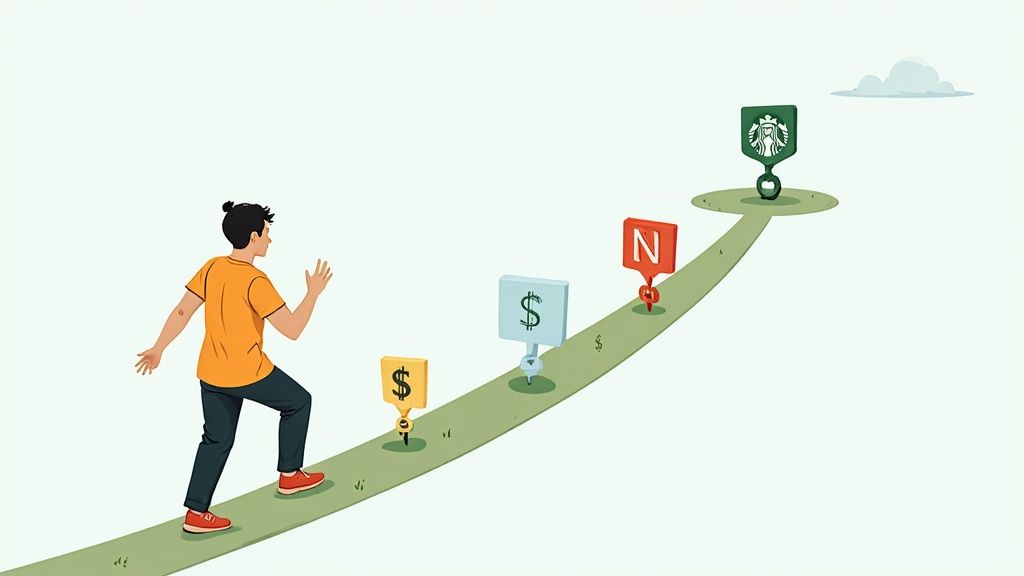
This simple infographic breaks down the selection process into a few clear steps.

Infographic showing a three-step process: selecting a familiar brand, choosing between stocks and ETFs, and reviewing metrics on a brokerage app.

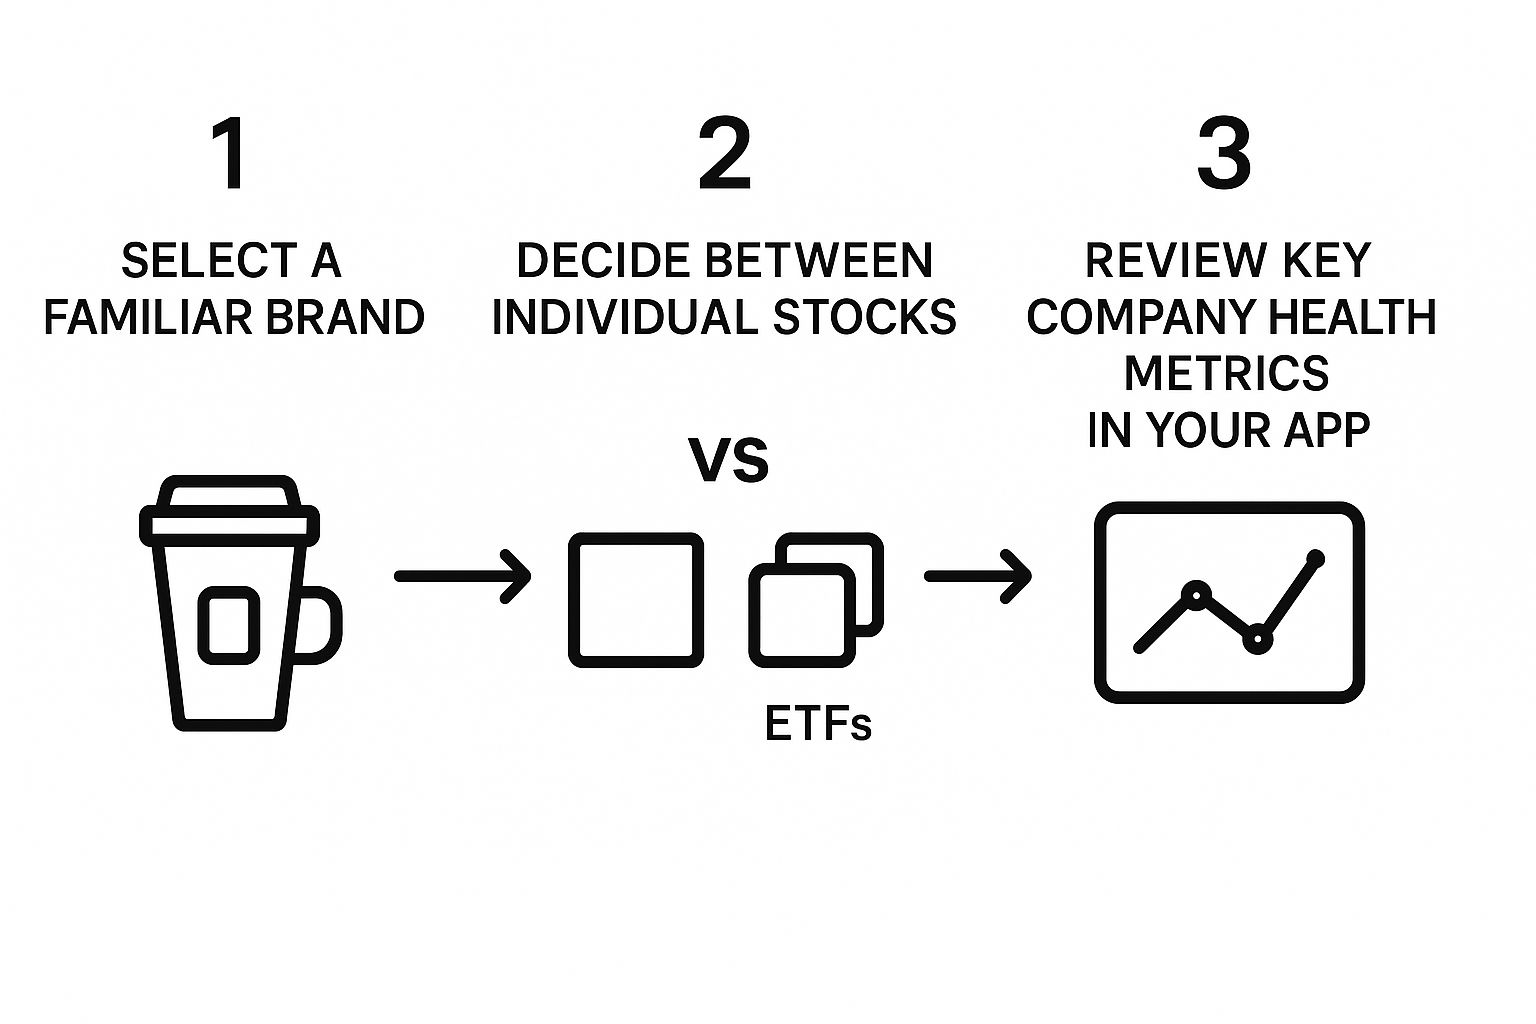
As the visual shows, getting started can be as easy as picking a brand you trust and then deciding if you want just that one company or a more diversified basket. If you want to dive deeper into how these funds work, you can explore the key differences in our detailed guide on ETF vs mutual funds.

Whatever you pick, your brokerage app will have simple tools to do a quick "health check" on a company or fund before you commit your cash.

Making Your First Stock Purchase

A person's hand holding a smartphone, with the screen displaying a clean, user-friendly brokerage app interface showing the final 'Confirm Purchase' button for a stock.

You've done the work and picked your first stock. Now for the exciting part – actually buying it. Thankfully, this is way simpler than you might think.

Just open your brokerage app, search for the company's name or its ticker symbol (like NKE for Nike), and tap the "Trade" or "Buy" button. Easy.

From there, you just need to tell the app how you want to buy the stock. This is where you’ll see a couple of key terms called order types. Understanding these is the secret to placing your first trade with confidence.

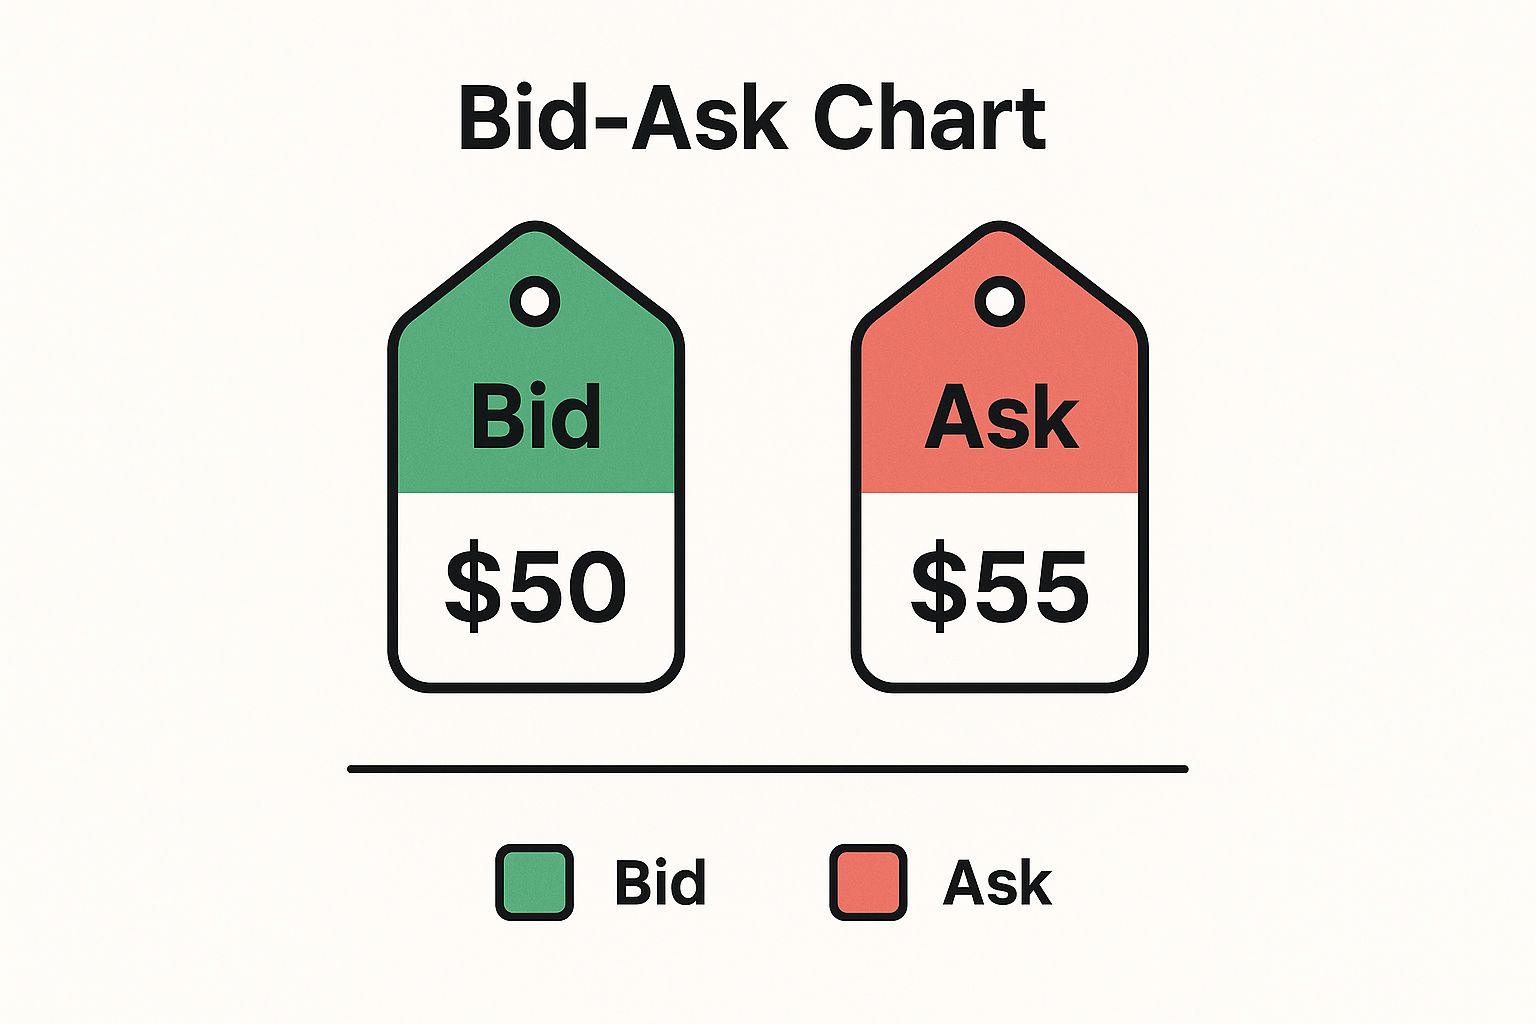
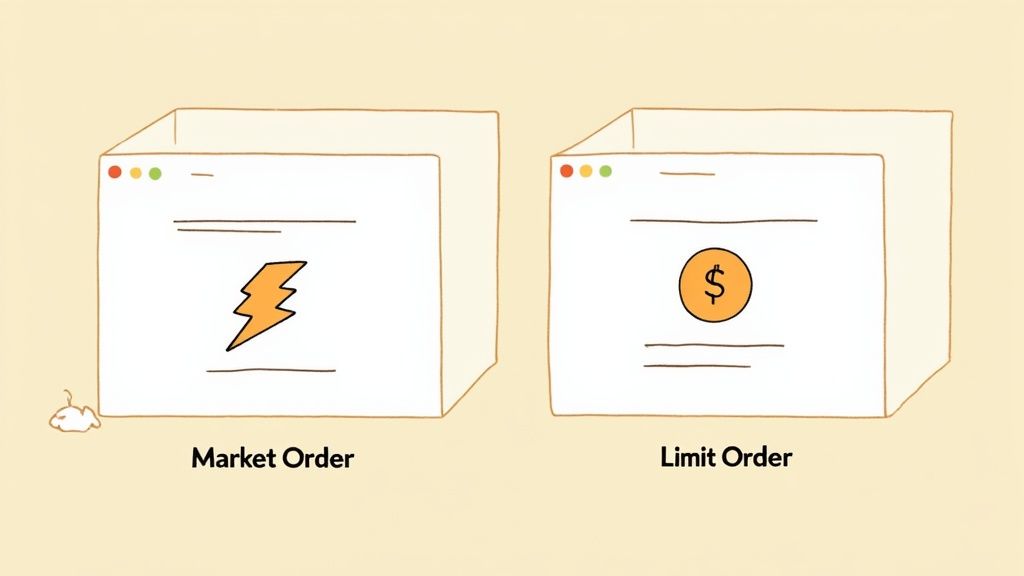
Market Orders vs. Limit Orders

The two main choices you'll see are market orders and limit orders.

A market order is the most straightforward option. It tells your broker, "I want to buy this stock right now, at whatever the current price is." It's fast, simple, and your order will almost always go through instantly. For most beginners, a market order is the perfect choice.

A limit order gives you more control. It's like saying, "I only want to buy this stock if the price drops to a specific number or lower." For instance, if Nike is trading at $95 a share, you could place a limit order for $94.50. Your purchase will only happen if the stock price hits your target. It's a great tool if you have a very specific price in mind.

The Magic of Fractional Shares

So, what happens when you want to own a piece of a powerhouse like Amazon, but a single share costs thousands of dollars? This is where fractional shares completely change the game for new investors.

Instead of needing the cash for a full share, you can just buy a small slice of one.

You don't need a huge bank account to get started. With fractional shares, you can buy $5 worth of Tesla or $10 worth of Apple. This lets you build a portfolio filled with amazing companies, even if you're starting small.

This is what makes modern investing so accessible. It allows you to begin your journey with whatever amount you're comfortable with. So go on, place that first order – you're officially an investor now.

Building Good Habits for Long Term Growth

Buying your first stock is a huge milestone, but let's be real: the secret to building actual wealth isn't about one lucky pick. It’s about building simple, repeatable habits you can stick with for years.

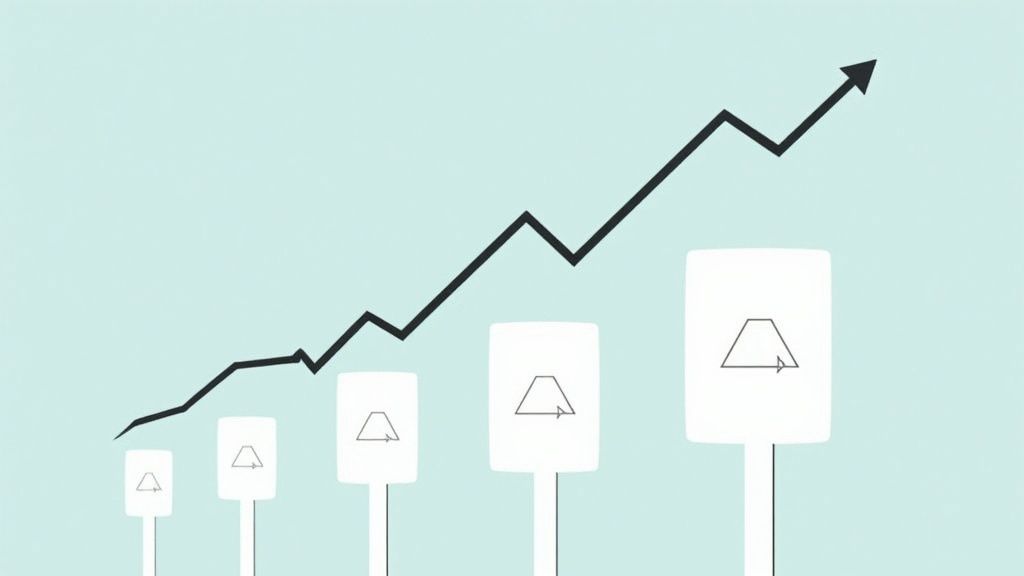
The real game is won with patience, not timing. Legendary investor Warren Buffett couldn't have said it better:

"The stock market is a device for transferring money from the impatient to the patient."

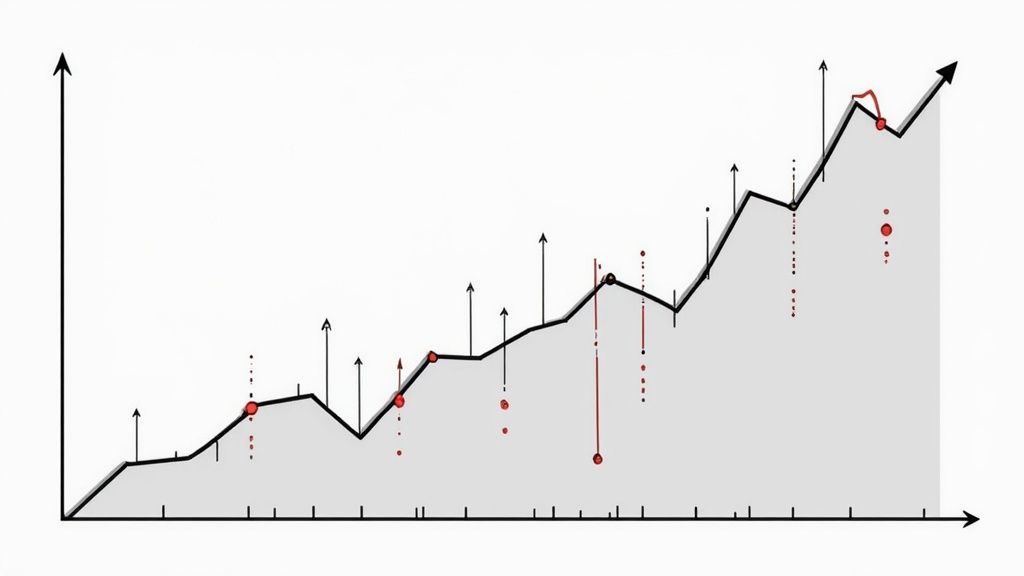
This mindset is your secret weapon. The market will have days where it feels like a rollercoaster. But history has shown us that the market trends upward over the long haul. Keeping your cool and sticking to your plan is how you come out on top.

Put Your Investing on Autopilot

One of the most powerful habits you can form is Dollar-Cost Averaging (DCA). It sounds way more complicated than it is. All it means is investing a fixed amount of money on a regular schedule – say, $25 every Friday – no matter what the market is doing.

This simple strategy works like a charm:

  • When prices drop, your $25 automatically buys more shares.
  • When prices are up, that same $25 buys fewer shares.

This takes the emotion and guesswork out of investing. No more stressing about trying to "time the market." It’s a disciplined, set-it-and-forget-it method that builds wealth steadily. Even Ashton Kutcher, known for his acting, is a savvy tech investor who talks about the power of automating good financial habits.

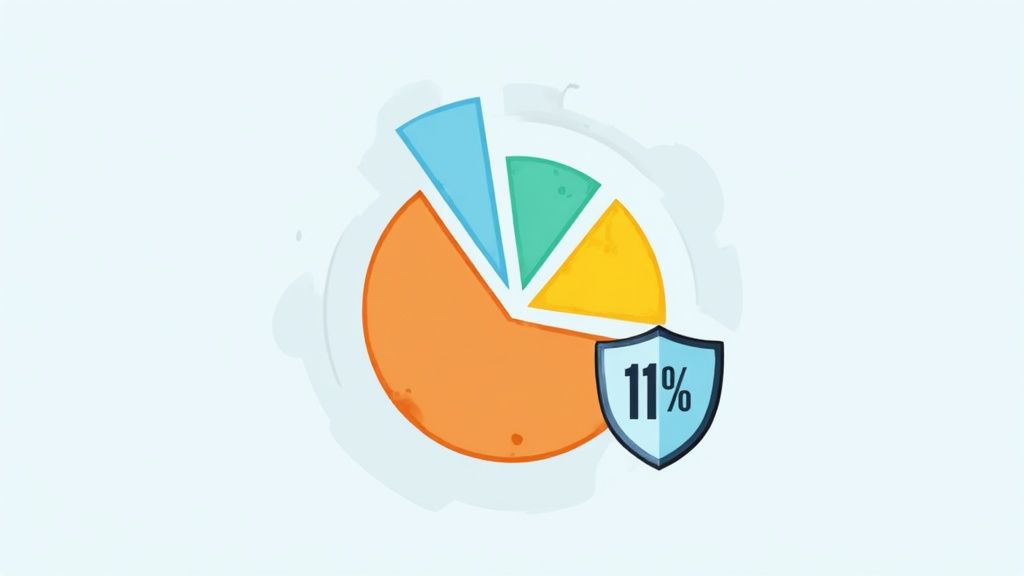
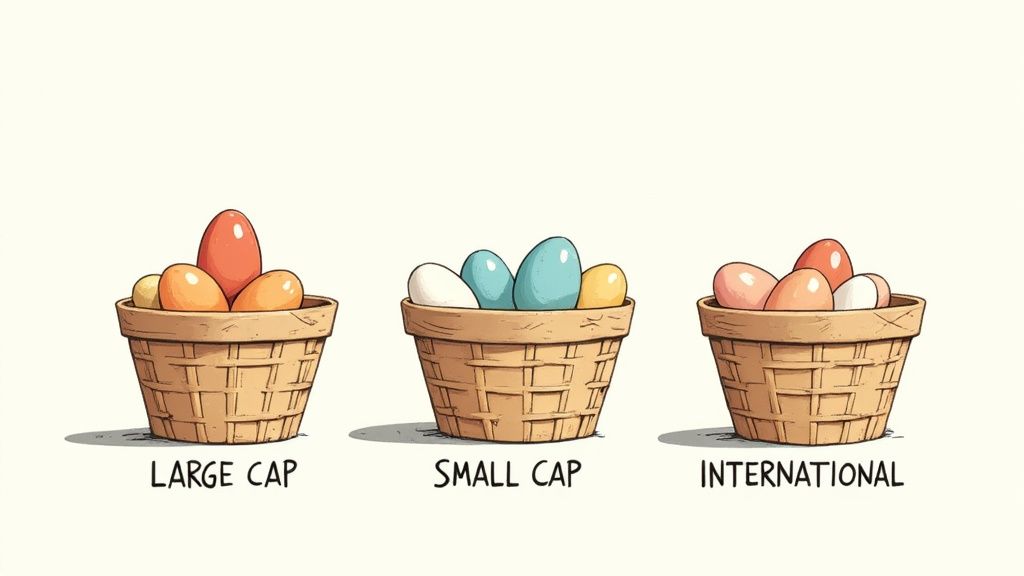
Don't Put All Your Eggs in One Basket

Another key habit is diversification. Think of it this way: you wouldn't bet your entire life savings on a single roll of the dice, so why put all your money into just one company? Spreading your investments across different stocks and industries gives you a crucial safety net.

The numbers back this up. Over the past century, global stocks have delivered an average annual return of around 5-7% after inflation. An attention-grabbing fact is that this return is significantly higher than what you'd get from gold, bonds, or just holding cash. You capture this long-term growth by holding a mix of investments.

If you want to dive deeper into these historical trends, check out the UBS Global Investment Returns Yearbook.

When you combine patience with automation and diversification, you're not just investing – you're building a powerful system for long-term growth. These habits aren't flashy, but they are the bedrock of any successful investing journey.

Got Questions? We've Got Answers

Stepping into the world of investing can feel a bit like learning a new language. You're going to have questions, and that's not just normal – it's smart. Let's tackle some of the biggest ones right away.

Even the sharpest investors started at square one. They asked questions, learned the ropes, and made their moves. Your journey starts the same way.

How Much Money Do I Really Need to Start?

Honestly, you can probably start with the cash from your part-time job. Thanks to fractional shares, most modern brokerage apps let you get in the game with as little as $5.

The starting amount isn't nearly as important as the habit. It’s far more powerful to invest $25 every month than to wait until you have a "perfect" lump sum. Consistency is where the magic happens.

Is This Just a Nicer Word for Gambling?

Not if you’re doing it right. Gambling is pure chance, like betting on a coin flip. You have zero control.

Smart investing is about owning a piece of a real business. You're buying into a company that you believe has a solid plan to grow and succeed over time.

You can’t control a roll of the dice, but you can absolutely research a company, understand what it sells, and make an educated decision. While there's always risk, you minimize it by thinking like a business owner, not a high-roller in Vegas.

Stocks vs. ETFs: What’s the Difference?

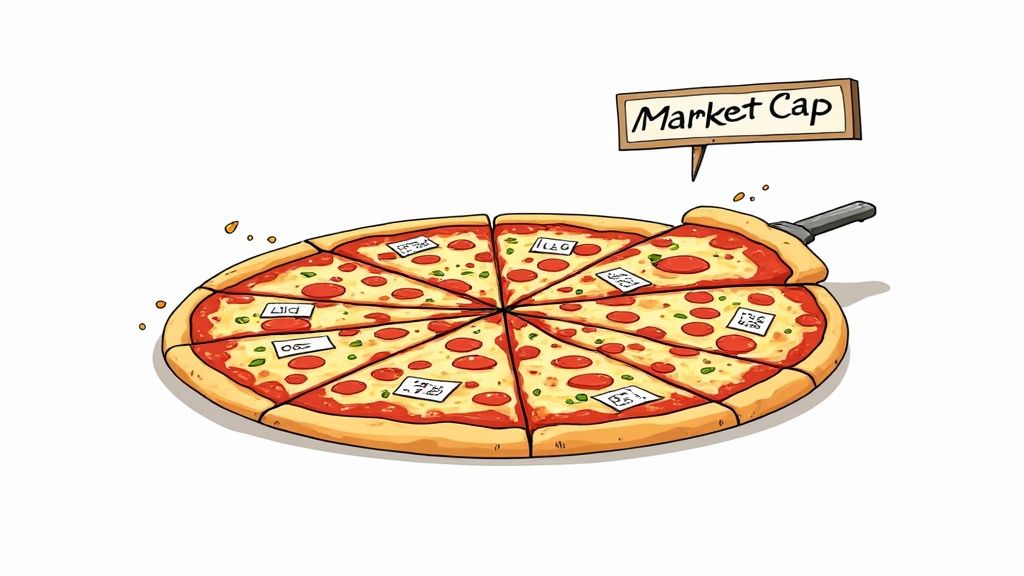
Let’s use a food court analogy. Buying a single stock is like ordering just a slice of pizza. You’re betting everything on that one slice being delicious.

An ETF (Exchange-Traded Fund) is like getting the combo meal – the pizza, fries, and a drink all in one go.

The combo meal (the ETF) gives you instant variety. It holds dozens or even hundreds of different stocks. So, if the pizza company has a bad day, the fries and drink can help balance things out. For beginners, ETFs are an incredible tool for instant diversification.

How Often Should I Be Checking My Portfolio?

I know it's tempting. You put your money in, and you want to see what it's doing every five minutes. But this is usually a recipe for stress.

The market has daily mood swings – it zigs and zags constantly. For anyone investing for the long term, checking in once a month or even quarterly is plenty. Your goal is to let your money grow over years, not minutes.


Ready to put this knowledge into practice? At financeillustrated.com, we specialize in making the markets feel less intimidating and a lot more fun. Our free Trading School and interactive simulators are built to boost your confidence before you risk a single real dollar. Start your journey with us at https://financeillustrated.com.

How to Read Stock Market Charts: A Simple Guide for Beginners

ye

Learning how to read stock market charts is like learning the secret language of money. It’s a visual story of the constant tug-of-war between buyers and sellers, a skill legendary traders like Jesse Livermore mastered over a century ago. The core idea is simple: understand the price's past moves to guess what might happen next.

Your First Look at Stock Charts

Ever glance at a stock chart and feel like you're staring at an alien language? You're not alone. Think of a chart as the market's heartbeat, telling the story of a company's stock through its price changes. We'll skip the heavy jargon and focus on what these lines and colors really mean.

A person pointing at a stock chart on a computer screen.

Before modern digital charts, traders had to get creative. One of the earliest forms of analysis was reading ticker tape, popular all the way until the mid-1960s. This meant analyzing market data from paper strips printed by stock tickers. A crazy fact: Thomas Edison, the guy who invented the lightbulb, actually invented an early version of the stock ticker!

Traders like Jesse Livermore relied heavily on this method, using price and volume data to spot market trends without the fancy charts we have today. If you're curious, you can explore more about the history of technical analysis and its evolution.

The Four Key Pieces of Price Information

At its core, a chart is just a visual story of data. Every period on a chart – whether it's one minute or one day – tells you four essential things about the stock's price. Nailing these is the first step to reading any chart. They are the building blocks of every pattern and trend you’ll eventually learn to spot.

Every chart tells a story using four main data points for a specific period (like a day or an hour). Understanding these is step one.

Data Point What It Tells You Why It Matters
Open The very first price a stock traded at when the market opened for that period. It sets the initial mood and gives you a starting line for the day's action.
High The absolute highest price the stock hit during that specific period. Shows how excited buyers got; it's the peak of optimism.
Low The absolute lowest price the stock dropped to during that period. Shows how nervous sellers got; it's the peak of pessimism.
Close The final price the stock traded at when the market closed for that period. Many pros see this as the most important price, showing who won the day's battle.

This data might seem simple, but it’s the DNA of market analysis. These four points are what create the different shapes and colors you'll see on more advanced charts, which we'll dive into next. Think of them as the alphabet – once you know the letters, you can start reading words.

Choosing Your Chart Type

When you're trying to figure out a stock's story, not all charts tell it the same way. Think of them like different camera lenses – some give you a wide, sweeping view, while others zoom in on the gritty details. Picking the right one is key to seeing what’s really happening with the price.

Let's break down the three main types you'll run into everywhere.

A person pointing at a stock chart on a computer screen.

It helps to think of these charts as an evolution. For centuries, traders have been trying to visualize market data to get an edge. What we use today, like Japanese candlesticks, is the result of a long history of innovation. Pioneers like Charles Dow, the brain behind the Dow Jones Industrial Average, helped turn simple price tracking into a legit analytical tool.

The Simple Line Chart

First up is the line chart, the most basic view you can get. It’s literally a connect-the-dots picture of a stock's closing prices over a set period.

This chart is perfect for getting a quick, clean look at the overall trend. Is the stock generally heading up, down, or just drifting sideways over the past year? A line chart shows you this at a glance. The big drawback? It completely ignores all the drama that happened during the day – the highs, the lows, and the battle between buyers and sellers.

The More Detailed Bar Chart

Next, we have the bar chart, which adds a few more layers to the story. Instead of just a single dot for the close, you get a vertical line for each period (like a day or an hour). This line represents the entire trading range, from the highest high to the lowest low.

Sticking out from this bar are two small horizontal lines, or "ticks":

  • The left tick: This shows the opening price.
  • The right tick: This shows the closing price.

Bar charts give you a much better feel for volatility. A long vertical bar means the price swung wildly, while a short one signals a calm, quiet trading session.

The All-Powerful Candlestick Chart

For most traders, the real star of the show is the candlestick chart. It packs the exact same four pieces of data as a bar chart (open, high, low, and close) but presents them in a way that's far more visual and easy to read. Honestly, once you get the hang of these, you probably won't want to go back.

Each "candle" is made of two parts:

  • The Body: This is the thick, rectangular part. It shows you the range between the open and close price.
  • The Wicks (or Shadows): These are the thin lines poking out from the top and bottom, showing the day's absolute high and low.

What makes candlesticks so powerful is the color. A green (or white) candle means the stock closed higher than it opened – a good day for the bulls (the buyers). A red (or black) candle means it closed lower – a win for the bears (the sellers).

This instant color-coding tells you the market's mood in a split second. A long green candle screams strong buying pressure, while a long red one signals heavy selling. Learning to interpret these shapes and patterns is a foundational skill in understanding how to read candlesticks.

Spotting Trends and Key Price Levels

Alright, now that you know what the candlesticks and bars on a chart are telling you, it's time for the fun part: reading the market's mood. Think of it like looking at a mountain range from a distance. Is the general direction heading up, sloping down, or just moving sideways?

Learning to spot these big-picture movements is one of the first major hurdles in understanding how to read stock charts.

A chart showing an uptrend with support and resistance levels.

This isn't just a technical skill for making money; it’s about understanding market psychology. Even legendary investors who aren’t glued to charts, like Warren Buffett, get the power of market sentiment. He famously said, "Be fearful when others are greedy and greedy when others are fearful." Seeing trends on a chart is a direct, visual way to see that greed and fear playing out in real-time.

Identifying the Main Trend

You’ve probably heard the saying, "the trend is your friend." It gets repeated so often because it's true. The trend is simply the overall direction a stock's price is heading. It boils down to three types:

  • Uptrend: Picture a staircase going up. The chart is making a series of higher highs and higher lows. This tells you buyers are in control, consistently pushing the price higher.
  • Downtrend: This is the opposite – a staircase heading down. You'll see a distinct pattern of lower highs and lower lows. In this case, sellers have the upper hand.
  • Sideways Trend (Consolidation): The price seems stuck, bouncing around within a specific range without making any real progress. Buyers and sellers are basically in a standoff.

A quick way to make the trend pop off the page is to draw a simple trend line. For an uptrend, just connect the lows. For a downtrend, connect the highs. This simple line can instantly clarify the market's direction.

Understanding Support and Resistance

This is where chart reading really starts to get interesting. Support and resistance are two of the most fundamental concepts you'll ever learn, and they are incredibly powerful.

Think of them as a floor and a ceiling that the stock price is trapped in.

  • Support (the floor): This is a price level where a downtrend often hits the brakes or even reverses. Why? Because enough buyers see the stock as a good deal at that price and step in, stopping it from falling further. It’s a psychological floor.
  • Resistance (the ceiling): This is a price point where an uptrend tends to run out of steam. Selling pressure gets stronger than buying pressure, creating a ceiling that the price struggles to break through.

These levels aren't magic; they're created by group psychology. When a stock approaches a previous high, some investors who bought lower decide it's a good time to sell and take profits. That selling creates resistance. On the flip side, when a stock drops to a previous low, other investors see a bargain and jump in, creating support.

A quick heads-up: these levels aren't unbreakable laws. They are simply areas where the probability of a price reversal is higher. A stock can absolutely smash through support or resistance, especially with a lot of people trading (high volume) – and that breakout is a powerful signal in itself.

Spotting these levels gives you a map of the battlefield, showing you where the big fights between buyers and sellers are likely to happen. It's crucial because markets can be wild. Historical data shows that even in years the market ends with big gains, scary drops are just part of the game. Since 1928, the S&P 500 has had an average drop of about -16.4% within each year. Knowing where potential support is can make that ride a lot less stressful. You can discover more insights about historical market behavior here.

Using Indicators to Get a Deeper Read

Alright, once you've got a feel for spotting trends and key price levels on a chart, it's time to bring in the heavy hitters. These are your indicators, and they're like getting a second opinion from a smart friend before you make a move.

We're not going to overwhelm you with a dozen different tools. Instead, let's focus on a couple of the most trusted indicators out there, plus the one thing many beginners ignore: trading volume.

Think of it this way: the price chart tells you what is happening. Indicators and volume help you understand why it's happening and how much power is behind the move. They add that extra layer of context that separates a wild guess from an educated decision.

Infographic about how to read charts stock market

This simple flow is how experienced traders approach a chart. You start with a Moving Average to get the general direction, check an indicator like the RSI to gauge momentum, and then look at volume to see if the move has any real power behind it.

Smoothing Out the Noise with Moving Averages

First up is the Moving Average (MA). It’s one of the most popular indicators for a simple reason: it helps. Its main job is to cut through the day-to-day chaos of price swings and show you the underlying trend more clearly.

It does this by averaging the closing price over a set number of days, like 20 or 50, and plotting that as a single, smooth line on your chart. When the price stays consistently above this line, it’s a strong signal that you're in an uptrend. If it's trading below the line, that points to a downtrend. It's a fantastic, no-nonsense way to get your bearings.

Is the Stock Overheated or on Sale?

Next, let's look at the Relative Strength Index (RSI). This is a momentum indicator. It basically measures how fast and how big recent price changes are to tell you when a stock might be "overbought" or "oversold."

The RSI is shown as a line that moves between 0 and 100. Here’s the simple way to read it:

  • A reading above 70 suggests the stock is overbought. Buyers have been piling in, and it might be running out of gas and due for a price drop.
  • A reading below 30 suggests the stock is oversold. Sellers have been dumping it, and it could be getting cheap enough to attract buyers for a bounce.

Think of the RSI like a car's engine meter. If the engine is revving in the red zone (over 70) for too long, you probably need to ease off the gas. If it's sputtering and about to stall (below 30), it might be time for a tune-up. It’s a gauge of market excitement.

The Importance of Trading Volume

Finally, we have to talk about Volume. This might be the single most underrated piece of information on a chart, but it's critical. Shown as bars at the bottom of your chart, volume simply tells you how many shares were traded in a given period.

So, why is this so important? Because volume is the fuel behind any price move. It shows you how confident the market is.

Imagine a stock jumps 5%. On its own, that looks great. But if it happened on super low volume, it’s not very convincing – it's like one person managing to push a car a few inches. Now, if that same 5% jump happens on massive volume? That’s like a whole crowd getting behind the car and shoving it down the street. That's a move you need to pay attention to, as it shows lots of people believe in the new price.

These core ideas of price, momentum, and volume aren't just for stocks. They're universal principles that apply across different markets. In fact, you'll find similar concepts when it comes to reading cryptocurrency charts and indicators as well.

A Practical Chart Analysis Framework

Knowing all the individual pieces of a chart is great, but the real magic happens when you start putting them together to read the market's story. Think of it like learning the alphabet versus reading a book.

What you need is a repeatable process – a consistent framework you can use every single time you pull up a chart. This helps build confidence and turns a chaotic screen of data into a clear story.

As the legendary investor Warren Buffett says, "Risk comes from not knowing what you're doing." This framework is your first step toward knowing exactly what you're doing. It all boils down to asking the right questions in the right order.

Your 5-Step Chart Reading Checklist

I like to think of this as a pre-flight checklist before making any trading decision. It forces you to cover the essential bases and stops you from getting laser-focused on just one thing.

Let's walk through this simple but powerful framework that helps you analyze any stock chart you come across.

Step Action Item Key Question to Answer
1 Identify the Trend Is the stock in a clear uptrend, downtrend, or just moving sideways?
2 Spot Key Levels Where are the most obvious support (floor) and resistance (ceiling) levels?
3 Check the Volume Does the trading volume confirm what the price is doing, or is it telling a different story?
4 Look at Indicators What are the Moving Averages and RSI telling me about momentum and strength?
5 Form a Thesis Based on everything I see, what is the most likely direction for the price to go next?

This checklist turns a potentially confusing jumble of lines into a structured analysis. It gives you a story, not just a snapshot.

Let's apply this to a real-world example, say, a chart of Tesla (TSLA).

First, you’d zoom out to get the big picture. What’s the main trend over the last six months? Is it making higher highs (uptrend) or lower lows (downtrend)?

Next, you'd start drawing. Mark horizontal lines where the price has repeatedly bounced up from (support) or struggled to break through (resistance). These are the battlegrounds.

After that, glance down at the volume bars. Did that last big price jump happen on a huge spike in volume? That’s a powerful confirmation. A move on low volume is way less convincing.

Finally, pull up your indicators. Is the price trading above its 50-day moving average? Is the RSI screaming overbought (above 70) or oversold (below 30)?

By answering these questions one by one, you build a complete story about the stock's current situation. This systematic approach is the foundation of solid chart analysis. For anyone looking to go a step further, exploring the basics of technical analysis will add even more powerful tools to your toolkit.

Common Questions About Reading Stock Charts

Jumping into the world of stock charts can feel like learning a new video game – you get the goal, but the rules and special moves can be a bit of a blur. It's totally normal to have questions.

Let's clear up some of that initial fog and tackle the things most beginners wonder about.

How Much History Should I Look At On A Chart?

That’s a fantastic question, and honestly, it all depends on your goals. Are you a day trader trying to make a quick profit in a few minutes? If so, you might only care about what’s happened in the last few hours.

But if you’re a long-term investor playing the Warren Buffett game, looking at charts that span several years gives you a much better feel for the big-picture trend. A good rule of thumb for anyone starting out is to pull up a one-year daily chart. It gives you enough data to spot major trends, support, and resistance levels without getting lost in the daily noise.

Can Chart Reading Predict The Future?

Let's be crystal clear: no chart, indicator, or so-called "guru" can predict the future with 100% accuracy. The market gets thrown around by countless unpredictable events, from surprise economic news to global politics. Heck, even celebrities can move markets – remember when a single tweet from Elon Musk could send the Dogecoin chart on a wild ride?

Think of chart reading not as a crystal ball, but as a weather forecast. It uses past data to identify patterns and probabilities, helping you make a more educated guess about what might happen next. It's about stacking the odds in your favor, not getting rid of risk completely.

How Do I Know Which Indicators To Use?

Walking into the world of technical indicators feels like trying to pick one snack from a massive candy store – there are hundreds! A classic beginner mistake is to plaster their chart with a dozen different lines and tools until it's unreadable.

Keep it simple. Start with the basics we've covered:

  • Moving Averages (like the 50-day and 200-day): These are fantastic for quickly seeing which way the trend is heading.
  • Volume: This one is non-negotiable. Always, always check if volume is confirming what the price is doing.
  • Relative Strength Index (RSI): A simple but powerful tool to gauge if a stock is getting overbought or oversold.

These three give you a solid foundation for analyzing pretty much any chart. Once you've got them down, you can start exploring others. Just don't get "analysis paralysis." As the legendary trader Paul Tudor Jones said, "The secret to being successful from a trading perspective is to have an indefatigable and an undying and unquenchable thirst for information and knowledge." Start simple, stay curious, and never stop learning.


Ready to put your knowledge into practice? At financeillustrated.com, we make learning fun and accessible. Explore our free Trading School, practice with risk-free simulators, and build your confidence before you ever risk a dollar. Start your trading journey the smart way at https://financeillustrated.com.

7 Actionable Daily Trading Tips for Young Investors in 2025

ye

Ever wondered how top traders seem to stay calm and consistently make smart moves? It’s not magic – it’s a system. They rely on a set of core rules they practice every single day, turning the crazy market into something they can manage. This isn't about complex math or needing a supercomputer. It’s about building smart habits, just like a pro athlete trains for a big game.

Forget the confusing jargon you see in movies. We're going to break down seven super practical, daily trading tips that anyone can understand and start using right away. Think of this as your personal trading playbook. We'll explore powerful ideas from legends like Paul Tudor Jones, who famously said, “The most important rule of trading is to play great defense, not great offense.” We'll even see how modern celebrities like Ashton Kutcher apply similar principles of smart risk-taking in their tech investments, focusing on solid strategies over wild gambles.

By the end of this guide, you’ll have a clear, actionable plan to approach the market with more confidence and control. You'll learn how to build a pre-market routine, manage risk like a pro, and review your moves to get better every single day. Let's dive in.

1. Start with a Solid Pre-Market Routine

Ever see pro athletes go through a strict pre-game ritual? It’s not just for show; it's about getting in the zone, focusing their energy, and preparing to win. As a trader, your "game" is the market, and your pre-market routine is your essential warm-up. It's the dedicated time you set aside before the opening bell to go from being a spectator to a prepared player.

This process means checking the news, looking at the economic calendar, and spotting potential trades before the market's chaos begins. By doing this, you create a game plan. This lets you trade with confidence instead of chasing every random price jump. Many successful traders, like Mike Bellafiore of SMB Capital, emphasize that your prep work directly predicts how well you'll perform.

How to Build Your Pre-Market Checklist

A good pre-market routine is like a pilot's pre-flight checklist – structured and repeatable. Here’s a simple framework you can use:

  • Global Market Check (30 mins): What happened while you were asleep? Look at major Asian and European markets (like the Nikkei or DAX). This gives you a feel for the overall market vibe. Did a major economic report from another country shake things up?
  • Economic Calendar Review (15 mins): Check for big economic news scheduled for the day, like inflation data (CPI) or job reports. These events can cause huge price swings, and you need to know when they’re happening.
  • Build Your Watchlist (30-45 mins): Use a pre-market scanner (you can find these on platforms like TradingView) to find stocks that are already busy with high trading volume. These are the "stocks in play." Instead of watching 50 stocks, narrow your focus to the top 3-5 that fit your strategy.
  • Chart Your Key Levels (15 mins): For each stock on your shortlist, find the key price levels where it previously bounced up (support) or got rejected (resistance). Mark these on your charts. This is your battle map for the day.

By following a consistent routine, you replace emotional guessing with a smart, strategic approach. This is one of the most crucial daily trading tips for long-term success. You're not just hoping for a good day; you're preparing for one.

2. Use the 1% Risk Management Rule

Imagine playing a video game where one mistake makes you lose everything. Super frustrating, right? Trading can feel that way without a good defense. The 1% rule is your ultimate shield. It's a simple rule: never risk more than 1% of your total account on a single trade. This isn't about limiting your profits; it's about making sure you stay in the game long enough to win.

Use the 1% Risk Management Rule

This simple rule is loved by legendary trading coaches because it mathematically prevents a few bad trades from wiping you out. A losing streak of five trades only results in a 5% account loss, which is totally manageable. Without this rule, the same streak could be a disaster. It forces you to focus on protecting your money, which is the real secret to lasting in trading. Fun fact: Even billionaire investor George Soros, known for his massive bets, was obsessed with risk management. He famously said, "It's not whether you're right or wrong that's important, but how much money you make when you're right and how much you lose when you're wrong."

How to Apply the 1% Rule

Applying this rule is a simple, two-step calculation you must do before entering any trade. To use this rule and manage any financial strategy, you need a good grasp of basic math concepts like understanding percentages. Here’s how it works:

  • Calculate Your Max Dollar Risk: First, figure out what 1% of your trading account is. If you have a $10,000 account, your maximum risk per trade is $100 ($10,000 x 0.01). This is the absolute most you can lose if the trade goes south.
  • Determine Your Stop-Loss: Before you trade, you must know your exit point if you're wrong. Let's say you want to buy a stock at $25 and your analysis says to put a stop-loss at $24.50. Your risk per share is $0.50.
  • Calculate Your Position Size: Now, divide your max dollar risk by your per-share risk. In our example: $100 (max risk) / $0.50 (risk per share) = 200 shares. That's the maximum number of shares you can buy for this trade.
  • Adjust for Every Trade: Your position size will change depending on the trade's stop-loss, but your max dollar risk (1% of your current account) stays the same. This disciplined approach is one of the most powerful daily trading tips for consistency.

By making this rule non-negotiable, you take emotion and fear out of your decisions. You're no longer gambling; you're managing risk like a pro.

3. Trade Only During High-Liquidity Sessions

Imagine trying to surf on a calm lake versus the ocean. The ocean has powerful waves and momentum, while the lake is flat and boring. The stock market is similar. Trading during high-liquidity sessions is like surfing in the ocean; there are more buyers and sellers (more "waves"), which means faster trades, better prices, and more reliable price movements.

Trade Only During High-Liquidity Sessions

This means you should focus your energy when the market is most active, usually the first and last hours of the trading day. Most of the day's action happens in these windows. By avoiding the slow, boring midday period, you can focus on the best opportunities and avoid the frustration of a market that's going nowhere. Pro traders often make most of their money during these key hours and use the midday lull for analysis, not for trading.

How to Focus on High-Liquidity Windows

Timing is everything. Knowing when to trade is as important as knowing what to trade. Here’s how to sync up with the market's most energetic periods:

  • The Golden Hours: For U.S. stock traders, the best times are usually 9:30 AM – 11:00 AM EST and 3:00 PM – 4:00 PM EST. Most pro day traders are done by 11:00 AM.
  • Avoid the Opening Chaos: The first 5-15 minutes after the market opens can be pure chaos. It’s often driven by overnight news and hype. Let the market settle and show its real direction before you jump in.
  • The Midday Dead Zone: From about 11:30 AM to 2:30 PM EST, trading volume often dries up. Big institutional traders are at lunch, and the market tends to drift sideways. This is a high-risk, low-reward time-perfect for practice, but not for your real money.
  • Watch for Overlaps in Forex: If you trade currencies, the best time is when major market sessions overlap. For the Euro vs. the US Dollar (EUR/USD), the sweet spot is when the London and New York markets are both open (8:00 AM – 12:00 PM EST). You can learn more about how to track these forex market hours on financeillustrated.com.

By using this timing strategy, you put the odds in your favor. This is one of the most effective daily trading tips because it forces you to trade when the market offers the clearest opportunities, helping you save your money and mental energy for when it counts.

4. Follow the Trend with Moving Average Confirmation

Ever heard the saying, "the trend is your friend"? It's one of the oldest trading rules for a reason. Instead of fighting the market's momentum, smart traders learn to ride its waves. Following the trend means you trade in the same direction the market is already going, and moving averages are the best tool to see which way that current is flowing.

Follow the Trend with Moving Average Confirmation

A moving average (MA) is a line on your chart that smooths out all the noisy price wiggles, making it easier to see the real trend. When the price is consistently above the moving average, it signals an uptrend; when it's below, it suggests a downtrend. Legendary traders like Paul Tudor Jones built their careers on this idea, knowing it's way more profitable to go with the flow than to swim against the tide.

How to Use Moving Averages for Trend Confirmation

Using moving averages is like having a GPS for the market. They give you clear, visual signals to guide your trades. Here’s a simple way to get started:

  • Identify the Main Trend: Use longer-term MAs like the 50-period and 200-period on a daily chart. When the 50 MA crosses above the 200 MA (a "Golden Cross"), it signals a strong bullish trend. A cross below (a "Death Cross") signals a bearish trend.
  • Find Your Entry Points: On a shorter timeframe (like a 5-minute chart), use faster MAs like the 9-period and 20-period Exponential Moving Averages (EMAs). In a strong uptrend, a common strategy is to buy when the price pulls back and touches the 20 EMA, which acts like a moving support line.
  • Combine with Other Clues: For a stronger signal, combine MAs with volume. If a stock bounces off its 20 EMA with a huge spike in buying volume, it’s a much more reliable signal than a bounce with low volume.
  • Know When to Stay Out: If the price is just chopping back and forth across the moving average, it means the market has no clear trend. This is a sign to be patient and wait for a clearer direction.

By using moving averages, you stop guessing and start making informed decisions based on the market's actual momentum. This is one of the most powerful daily trading tips for building a consistent and disciplined approach.

5. Set Multiple Profit Targets and Scale Out

Ever closed a winning trade just to watch it double in price without you? It’s a terrible feeling. On the other hand, holding on for a huge gain only to see it reverse and turn into a loss is even worse. This is where a pro technique called "scaling out" comes in. It’s a strategy that lets you lock in profits while still giving you a shot at a bigger move.

Instead of an all-or-nothing approach where you sell everything at one price, scaling out means selling parts of your position at different, pre-planned price levels. This powerful method, used by legendary traders like Linda Raschke, helps reduce stress and removes the emotional guesswork. It turns taking profits from one big, scary decision into a calm, multi-step process.

How to Scale Out of Your Trades

The key is to have your exit plan figured out before you even enter the trade. This pre-planning is one of the most vital daily trading tips for staying disciplined. Here’s a practical way to do it:

  • Define Your Targets Before Entry: Let's say you buy 300 shares of a stock. Before you click "buy," decide on your exit points. For example, your plan could be to sell 150 shares at your first target (e.g., +$0.50), another 100 at your second target (e.g., +$1.00), and let the final 50 shares run.
  • Move Your Stop-Loss to Breakeven: This is a game-changer. Once your first profit target is hit, move your stop-loss for the remaining shares up to your original entry price. This makes the rest of the trade "risk-free," since you can't lose money on it anymore. This one move can dramatically improve your trading psychology.
  • Use Charts to Set Realistic Levels: Don't just pick profit targets out of thin air. Use your chart to find logical resistance levels or other technical points where the price might struggle. The Average True Range (ATR) indicator is also a great tool for setting realistic targets based on the stock's typical daily movement.
  • Adjust Based on the Market: Be flexible. In a choppy, uncertain market, you might want to scale out faster, taking more profit at your first target. In a strong, trending market, you might let a bigger piece of your position run for a larger gain.

By scaling out, you pay yourself along the way. It’s a disciplined approach that balances greed and fear, allowing you to lock in gains while still having a chance at those massive home-run trades.

6. Wait for Confirmation Before Entry

Ever jumped into a trade thinking it was a "sure thing," only to see the price immediately go against you? This happens when you act on what you think will happen instead of what is actually happening. Waiting for the market to confirm your idea is like waiting for the green light before crossing the street; it’s a simple rule that makes you much safer and more successful.

This means you let the price action prove you're right before you put your money on the line. For instance, instead of buying a stock the second it touches a support level, you wait for a clear signal that other buyers are actually showing up. Legendary traders like Peter Brandt, who is a master of chart patterns, built their careers on this discipline. They know that a potential setup isn't the same as a valid one.

How to Practice Patient Confirmation

Confirmation turns your trading from a guessing game into a methodical process. Here’s a checklist to help you wait for the right signals:

  • Define Your Signal Clearly: What does confirmation look like for your strategy? Write it down. Is it a 5-minute candle closing clearly above a resistance line? Is it a breakout with a big spike in volume? Be specific.
  • Use Price Action Patterns: Look for validating candlestick patterns on your chart. For a long entry at support, you might wait for a bullish engulfing candle (a big green candle that "eats" the previous red one) to form. This shows that buyers have taken control.
  • Combine Your Signals: Don't rely on just one thing. A stronger setup might be a price breaking above a key moving average and being confirmed by a surge in buying volume. Two signals are better than one.
  • Set Price Alerts: Instead of staring at the chart and getting tempted to jump in too early, set an alert at your confirmation level. This frees up your mental energy and forces you to wait for the market to come to you.

Adopting this practice is one of the most powerful daily trading tips for filtering out weak trades and avoiding emotional, impulsive decisions. You might miss the very beginning of a move, but you will catch more of the reliable, high-quality trades that actually make you money.

7. Review and Journal Every Trade

Imagine a pro athlete watching game tapes to find their mistakes and strengths. That's exactly what a trading journal does for you. It's your personal "game tape," helping you learn from your experiences. Journaling is what separates a novice trader who gets lucky or unlucky from a professional who understands their own performance.

This process involves writing down every single trade-not just the wins, but especially the losses. You record why you took the trade, your entry and exit points, and even how you were feeling. A famous trading psychologist, Brett Steenbarger, often says that self-awareness is a trader's greatest asset. A journal is the best tool for building that awareness, turning your trading data into a roadmap for improvement. Even someone like Oprah Winfrey, a master of self-reflection, has championed journaling for years as a way to understand one's own patterns and achieve goals.

How to Build Your Trading Journal

A great journal is more than just a list of wins and losses; it’s a story of your decision-making. Here’s a simple framework to get started:

  • Capture the Essentials: For every trade, log the date, stock ticker, entry price, exit price, stop-loss, and final profit or loss. This is your basic data.
  • Explain Your "Why": Why did you take this trade? Was it a chart pattern? A news story? Write down your reasoning. Also, take a screenshot of the chart when you entered and exited, and draw your notes on it. This visual context is priceless.
  • Track Your Mindset: Rate your emotional state on a scale of 1-5. Were you feeling confident, fearful, or greedy? You might discover that your worst trades happen when you're feeling emotional.
  • Review and Find Patterns: Every weekend, review your week's trades. Look for patterns. Do you always lose money on Fridays? Do your best trades come from a specific setup? This is where your data turns into powerful insights. To take it a step further, you can learn how to backtest your trading strategies to see if your patterns hold up over time.

By keeping a journal, you create a feedback loop that helps you learn faster. This is one of the most powerful daily trading tips because it forces you to be your own coach, helping you find your strengths and eliminate costly mistakes.

7 Key Daily Trading Tips Comparison

Strategy 🔄 Implementation Complexity ⚡ Resource Requirements 📊 Expected Outcomes 💡 Ideal Use Cases ⭐ Key Advantages
Start with a Solid Pre-Market Routine Medium (30-90 min daily early start) Requires access to news, futures, alerts Better prepared trades, reduced impulsivity Day traders preparing for market open Reduces emotions, identifies setups early
Use the 1% Risk Management Rule Low-Medium (requires precise calculations) Basic math tools, position size calculator Capital preservation, steady account growth All traders prioritizing risk control Protects capital, promotes discipline
Trade Only During High-Liquidity Sessions Low (time-restricted trading hours) Requires trading during key sessions Tighter spreads, better execution, clearer trends Day traders focusing on volatile market periods Lower costs, higher quality setups
Follow the Trend with Moving Average Confirmation Medium (requires indicator setup) Charting software with MA indicators Higher win rates, clearer trend direction Trend followers and technical analysts Clear entry signals, removes guesswork
Set Multiple Profit Targets and Scale Out Medium-High (complex position management) Advanced order management capability Reduced regret, improved risk-reward Traders managing profits on longer intraday/swing trades Locks partial profits, eases exit-related anxiety
Wait for Confirmation Before Entry Medium (requires patience and rules) Alert systems, charting tools Higher win rate, fewer false signals Traders seeking improved trade quality Reduces false breakouts, builds discipline
Review and Journal Every Trade Medium-High (ongoing daily commitment) Journal software or spreadsheets Improved performance via self-analysis All traders committed to continuous improvement Identifies patterns, enforces accountability

Your Daily Checklist for Smarter Trading

You've just learned seven powerful daily trading tips that form a blueprint for a disciplined and successful trading routine. Think of this as your new daily checklist. From the Pre-Market Routine that sets you up for success to the non-negotiable 1% Risk Management Rule that protects your money, you now have the tools to trade with a plan, not just a feeling.

The journey to becoming a consistent trader is a marathon, not a sprint. Legendary investor Warren Buffett once said, "The stock market is a device for transferring money from the impatient to the patient." This wisdom is at the heart of the tips we've discussed. Waiting for confirmation, trading only during the busy hours, and scaling out of positions are all acts of patience. They are the small, smart actions that separate pro traders from amateurs.

Making These Habits Stick

Knowing these tips is one thing, but making them habits is what really matters. Your trade journal is your personal coach, helping you learn from every win and loss. Your pre-market analysis is your strategic map for the day ahead.

Staying this disciplined day after day takes mental stamina. A trader's performance is tied directly to their mindset. It's crucial to create an environment that helps you focus. For practical strategies on this, you can explore ways to stay focused and boost productivity during your most critical trading hours. Mastering your focus is just as important as mastering your strategy.

Your Path Forward: From Knowledge to Action

The difference between reading about trading and becoming a trader is practice. The tips in this article are your building blocks. But you have to be the one to put them together. By committing to this checklist, you build a professional framework for your trading decisions. This structure will guide you through market ups and downs and help you make calculated moves instead of impulsive guesses. Start tomorrow. Choose one tip to master this week, then add another next week. Before you know it, these practices will become second nature, paving your way toward smarter, more confident trading.


Ready to turn these daily trading tips into real skills without risking a single dollar? Visit financeillustrated.com to access our interactive trading simulator, educational games, and in-depth courses. It's the perfect environment to practice everything you've learned here and build the habits of a pro trader in a fun, risk-free setting.

What Does Overweight Rating Mean? A Guide for Young Investors

ye

Ever heard a Wall Street expert call a stock "overweight" and felt totally lost? Don't worry about it. It's just finance jargon, and it's way simpler than it sounds. An overweight rating is basically a professional analyst giving a stock a massive thumbs-up. They're signaling they believe it's about to perform better than its rivals or the market in general.

Decoding the Analyst's Thumbs-Up

Imagine your investment portfolio is like your favorite playlist. You have a mix of different artists and genres to keep things balanced. An overweight rating is like a music critic telling you, "Hey, that new Taylor Swift album is a banger-you should add more of her songs to your playlist." You're giving that specific stock more "weight" or a bigger spot in your portfolio than you normally would.

This isn't just a random guess. It's a strong vote of confidence from someone who spends their days analyzing a company's financial health, its industry, and its future potential. They're basically telling investors that they see a bright future for this particular company.

Why This Rating Matters

An overweight rating is a recommendation based on data, not just a casual opinion. Analysts give this rating when they expect a stock to beat its benchmark, like the S&P 500, over the next 6 to 12 months. This confidence usually comes from solid fundamentals like growing profits, a cool new product launch, or positive trends in their industry.

For example, an analyst might give a gaming company an overweight rating right before they release a highly anticipated new video game, expecting a huge jump in sales and its stock price. It's a strategy used by legendary investors like Warren Buffett, who makes huge "overweight" bets on companies he deeply believes in, like his massive investment in Apple.

This chart gives you a quick visual of how an overweight position compares to others.

Infographic about what does overweight rating mean

As you can see, it’s all about intentionally putting more money into one stock than its "slice" of the market suggests. This isn't just theory; it has a real impact. One study found that stocks in the S&P 500 with a consensus overweight rating performed 4.2 percentage points better than their peers over the next year. You can find more cool facts like this over at SoFi's learning center.

Analyst Stock Ratings Explained

To get the full picture, it helps to see how "overweight" compares to the other common ratings analysts use. Here’s a simple chart to help you remember.

Rating What It Means for the Stock Your Game Plan
Overweight (Buy) The analyst is optimistic and expects the stock to do better than the rest. Consider buying the stock or adding more if you already own it.
Equal-weight (Hold) The analyst thinks the stock will perform about the same as the market. No big moves expected. If you have it, keep it. If not, there might be more exciting options.
Underweight (Sell) The analyst is pessimistic and expects the stock to do worse than others. Consider selling your shares or avoiding this stock for now.

Think of these ratings like a traffic light for your money: green for overweight, yellow for equal-weight, and red for underweight. It’s an easy way to understand what a professional analyst is thinking.

How Do Analysts Find These "Overweight" Stocks Anyway?

A financial analyst reviewing charts and data on a computer screen.

So, how does an analyst decide a stock is a potential superstar? It’s not a magic crystal ball-it's more like being a financial detective. They dig deep into a company's story, looking for clues that suggest it's ready to outperform everyone else.

This process involves some serious research. Think of it like a scout for a professional sports team checking out a rising star. They look at everything, from past performance to future potential, to decide if they've found the next big thing.

The Detective Work Behind the Rating

Analysts spend their days going through financial reports, searching for signs of a healthy, growing business. They're looking for specific signals that a company has a bright future, which would earn it that awesome overweight rating. It’s a detailed process that mixes hard numbers with a bit of a gut feeling about the future.

Some of the key clues they look for include:

  • Strong Earnings Growth: Is the company making more money than it did last year? A history of growing profits is a huge green flag.
  • A Solid "Moat": Does the company have a unique advantage that protects it from competitors? This could be a super strong brand (like Nike) or some killer technology nobody else has.
  • Great Leadership: Is the CEO and their team experienced and respected? Think about how visionary leaders like Steve Jobs or Elon Musk transformed their companies.
  • Favorable Industry Trends: Is the company part of a bigger trend, like the growth in artificial intelligence or electric vehicles? A rising tide lifts all boats.

"Investing is not a game, but a serious business where you must conduct proper research." – Benjamin Graham

The Numbers Tell the Story

This detective work isn't just about feelings; it's backed by powerful data. For example, a 2019 analysis found that S&P 500 stocks with overweight ratings had an average earnings growth rate of 23.5%. That completely smoked the 12.8% seen in stocks with an "equal-weight" rating.

The same study also showed that these top-rated stocks were 40% more likely to have better-than-average profit margins. This just proves how much strong financials matter. You can learn more about these findings and explore what an overweight rating indicates.

Ultimately, it could be anything from a groundbreaking new product, an expansion into a new country, or just a fantastic quarterly earnings report that convinces an analyst a company is ready for the spotlight.

Real-World Examples of Overweight Stocks

A close-up of the Nike and Apple logos on smartphones.

Alright, let's move from theory to reality with some brands you definitely know. Seeing an overweight rating on a company you recognize is often when the idea really clicks. Big names like Apple and Nike often get this positive nod from analysts, and understanding why can be a game-changer for your own investing mindset.

Analysts aren't just picking these names randomly. When a firm gives an overweight rating to a company like Apple, they’re pointing to solid, clear reasons for their optimism. It’s about connecting what we see as consumers-like the new iPhone everyone is talking about-to what an analyst sees as a great investment.

Why Analysts Love Big Brands

For a giant like Apple, the reasons for an overweight rating are usually right in front of us. Analysts love its massive, super-loyal customer base and its powerful ecosystem of products that keep users hooked. People literally camp out for the newest iPhone, and that loyalty turns into predictable, huge sales.

Nike's power is just as obvious. Its brand is a global force, recognized everywhere from New York to Tokyo. This brand power creates a huge competitive advantage, allowing Nike to charge premium prices and stay ahead of its rivals. Even celebrities and athletes like LeBron James are deeply tied to the brand, making it more of a cultural icon than just a sneaker company.

"Go for a business that any idiot can run – because sooner or later, any idiot probably is going to run it." – Peter Lynch

This famous quote from legendary investor Peter Lynch nails it. Analysts often look for companies with simple, powerful business models that are easy to understand. They want businesses with strong, lasting advantages that can survive tough times and changes in leadership.

Seeing the Rating in Action

When these huge companies get an overweight rating, it can often signal a period of strong performance is coming. For example, an analyst might upgrade Nike to overweight after seeing a massive increase in their international sales, betting that this growth will continue and push the stock price higher. Think of these ratings as a flare, signaling that the pros see hidden potential.

By looking at companies you already know and admire, you can start to think like an analyst. You begin to connect a great product or a dominant brand to its potential as a smart investment. It’s the best way to learn how the pros spot their next big winner.

Putting an Overweight Rating to Work in Your Portfolio

Okay, you get the idea behind an overweight rating. But how do you actually use this information? This is where you put on your investor hat and turn an analyst's opinion into a real strategy.

The concept isn't just about one company. You can apply it to a whole industry you believe is about to blow up, whether that’s artificial intelligence, clean energy, or even the esports world. It’s about tilting your portfolio toward the areas where you see the most potential.

A chart showing a balanced portfolio versus one that is overweight in technology stocks.

Thinking Like a Portfolio Manager

Think of your portfolio like a pizza. In a standard, balanced portfolio, each slice represents a different sector-maybe you have 25% in tech, 25% in healthcare, and so on. Pretty even.

But let's say you've done your research and you're super optimistic about the future of tech. You can decide to make that "tech slice" bigger, increasing its allocation to 35% or even more. Just like that, you are now overweight in technology. You've given it a bigger piece of your portfolio than its standard weighting, based on your own research and confidence.

This isn't just theory; it works. For instance, during the tech boom of 2020-2021, portfolios that were overweight in tech stocks managed to outperform the overall market by a whopping 18%. This shows how a smart overweight position can boost your returns when you get it right.

Building Your Overweight Strategy

Deciding to go overweight is a proactive move. It’s you saying, "I believe this area has more potential to grow than the others." It's a way to focus your bets on your strongest ideas instead of just spreading your money evenly everywhere.

To see what this looks like, let's compare a standard portfolio against one with a tech-heavy focus.

Portfolio View: Equal Weight vs. Overweight in Tech

Portfolio Type Tech Allocation Healthcare Allocation Financials Allocation Other Allocation
Standard Portfolio 25% 25% 25% 25%
Overweight Tech 40% 20% 20% 20%

This strategic shift is exactly how many smart investors build their wealth. They make focused, overweight bets on the companies and industries they truly believe will shape the future.

Of course, going overweight in one area means you’ll be underweight in others. This makes balancing your overall portfolio super important for managing risk. For a closer look at this balancing act, check out our full guide on how to diversify your investment portfolio. It’s a powerful strategy, but you need a smart approach to avoid putting all your eggs in one basket.

The Risks of Following Overweight Ratings

Seeing an "overweight" rating on a stock you own (or are watching) can feel exciting. It's easy to get caught up in the hype and think you've found a guaranteed winner.

But slow down. Before you even think about going all-in, you have to remember the golden rule of investing: there are no guarantees. Not one. Even the smartest experts on Wall Street can't predict the future.

Think of an overweight rating as a well-researched opinion, not a crystal ball. The market can be unpredictable. A surprise product launch from a competitor, a sudden economic shift, or even a viral tweet from someone like Elon Musk can completely change a stock's path overnight.

Forecasts Are Not Fortunes

Analysts do their homework, digging through financial reports and building complex models. But at the end of the day, their predictions are based on assumptions-and reality can shatter those assumptions in an instant. This is exactly why putting all your money into a single stock is one of the riskiest things a new investor can do.

"The key to making money in stocks is not to get scared out of them." – Peter Lynch

This classic quote from investing legend Peter Lynch hits the nail on the head. The best way to avoid getting scared out of the market is by not having all your hopes pinned on one stock. This is where your financial superpower comes in: diversification.

Why Diversification Is Your Best Friend

Diversification is a simple idea: don't put all your eggs in one basket. It’s about building a financial safety net.

By spreading your money across different stocks, industries, and even different types of investments, you protect your portfolio from the inevitable ups and downs. If one of your "overweight" picks suddenly drops, your other investments are there to soften the blow. It’s about building a portfolio that’s tough enough to handle whatever the market throws at it.

Smart investors use analyst ratings as a signal to start their own research, not as the final answer. It's always a good idea to check things out for yourself before putting real money on the line. In fact, learning how to backtest trading strategies is a great way to see how a stock might have performed in the past without risking any of your own cash.

An overweight rating is a clue, not the whole answer. It's your job to solve the rest of the puzzle.

Got Questions About Stock Ratings? Let's Clear Them Up.

Still have a few questions buzzing in your head? You're not alone. Let's tackle some of the most common ones so you can feel more confident.

What Happens if a Stock I Own Gets Downgraded?

First of all, don't panic. If an analyst downgrades a stock you own-say, from "overweight" to "equal-weight"-remember that it's just one person's opinion changing. It might cause the stock price to dip for a bit as some people sell, but it’s definitely not a command to dump your shares.

Instead, use it as a reminder to do your own homework. Go back to why you bought that stock in the first place. If your original reasons are still solid, holding on might be the smart move, especially if you're investing for the long term.

How Often Do These Ratings Actually Change?

Ratings aren't set in stone; they can change pretty often. You'll frequently see analysts update their ratings every three months, right after a company releases its latest earnings report.

But they can also change unexpectedly because of big news, like a major merger, a revolutionary new product launch, or even a scandal. It’s a dynamic process that moves with the constant flow of new information.

"The stock market is filled with individuals who know the price of everything, but the value of nothing." – Phillip Fisher

This is a great reminder that a rating is often tied to a short-term price. Your focus should always be on the real, long-term value of the business itself.

Okay, So Where Do I Find These Ratings?

Good news: you don’t need a secret Wall Street password to find this information. Analyst ratings are widely available.

You can easily find them on major financial news websites like Yahoo Finance, Bloomberg, and MarketWatch. Most online brokerage platforms also include this information right on their stock research pages, giving you direct access. Just remember, it's one tool in your toolbox, not the whole set.


Ready to stop just learning and start doing? At financeillustrated.com, we make trading simple and fun with interactive simulators and bite-sized lessons. Build your skills risk-free before you ever invest a dollar. Check out our free Trading School at https://financeillustrated.com.

What Is Paper Trading? A Beginner’s Guide to Practicing for Free

ye

Ever wish you could hit "undo" on a bad decision? In the stock market, you can’t. But what if you could practice trading without the stomach-churning stress of losing real money? That's exactly what paper trading is for.

Imagine playing a high-stakes poker game, but with monopoly money. Paper trading is a simulation that lets you buy and sell stocks, crypto, and other assets using fake money in a real-time market environment. It's the perfect way for a beginner to get their feet wet and practice their moves without risking a single actual dollar.

Your Personal Stock Market Sandbox

Think of it like a flight simulator for a pilot or a scrimmage before the big game. It’s a dedicated space where you can get comfortable with a trading platform, figure out how market orders really work, and watch your decisions play out with zero financial consequences.

This isn't some new idea. The legendary trader Jesse Livermore – one of the most famous speculators of all time – reportedly got his start by mentally "trading" the stock prices he saw ticking by on the tape. That was just an old-school, manual version of what we do today.

In fact, it's become a standard first step for new traders. One study found that over 60% of new retail traders in the United States jump into a paper trading platform before putting their own capital on the line. It's just a smarter way to learn. You can find more insights about paper trading and its growing popularity online.

To give you a better idea of what we're talking about, here's a quick summary.

Paper Trading at a Glance

This table breaks down the core components of paper trading into simple terms.

Feature Description
Environment A simulated trading platform that mirrors a real brokerage account.
Capital You're given a virtual cash balance (e.g., $100,000) to trade with. No real money is ever at risk.
Market Data Uses real-time or slightly delayed data from actual stock exchanges like the NYSE and NASDAQ.
Primary Goal To practice trading strategies, learn platform mechanics, and build confidence without financial loss.
Key Benefit A completely risk-free educational tool.
Main Drawback Doesn't replicate the real emotional pressure of having your own money on the line.

Essentially, it's the ultimate "try before you buy" experience for the stock market.

What Does a Paper Trading Account Look Like?

Most modern paper trading platforms are designed to look and feel exactly like a real brokerage account. This screenshot from Investopedia shows a pretty standard paper trading interface.

Screenshot from https://www.investopedia.com/paper-trading-4689693

You've got your portfolio balance, live stock charts, and the same buttons to buy or sell that you'd find in a live account. The only difference? That account balance is just for show. It’s all virtual, which lets you click "buy" and "sell" without a second thought.

The whole point is to build muscle memory and sharpen your strategic thinking. As the investing icon Benjamin Graham famously said, "The investor's chief problem – and even his worst enemy – is likely to be himself."

Paper trading gives you a safe arena to face that challenge head-on. It helps you learn to control your impulses and stick to a plan – the perfect foundation for anyone hoping to build the skills and confidence needed to step into the real market.

The Real Benefits of Practicing with Virtual Money

A person sitting at a desk with a laptop displaying financial charts and graphs

So, why would anyone bother trading with fake money? Simple: it’s your personal, zero-risk sandbox. This is where you get to build confidence, test-drive different investing styles, and make all the classic rookie mistakes without losing a single real dollar.

Think of it as a flight simulator for traders. You learn the ropes and figure out the technical side of placing orders – like the difference between a “market order” and a “limit order” – when the stakes are literally zero. It’s your chance to rehearse before the big show.

“The beautiful thing about learning is that nobody can take it away from you.” – B.B. King

That quote wasn’t about the stock market, but it hits the nail on the head. The knowledge you bank from practicing is yours forever. The losses? They're completely imaginary. It's a pretty powerful trade-off.

Mastering Your Mindset and Skills

Beyond just clicking buttons, paper trading is where you forge the discipline and emotional control every real trader needs. It's like a basketball player shooting hundreds of free throws in an empty gym. That repetition builds the muscle memory and mental toughness required to perform under pressure.

It’s the perfect place to explore different strategies and see what fits your personality:

  • Day Trading: Get a feel for the lightning-fast pace of buying and selling within the same day.
  • Swing Trading: Learn to hold positions for a few days or weeks to catch those short-term market "swings."
  • Long-Term Investing: Practice the art of buying and holding quality assets, focusing on the big picture just like the pros.

Even seasoned pros know the power of practice. Mark Cuban, the billionaire owner of the Dallas Mavericks, famously reads for hours every day to keep his edge. Paper trading is your active-learning equivalent. It’s how you prepare for the real game.

Ultimately, the goal is to get a genuine feel for the market's natural ups and downs in a completely safe space. By mastering the tools and getting a handle on market psychology first, you’re building a solid foundation before you ever put your own money on the line. Honestly, it's the smartest first step you can possibly take.

Choosing The Best Paper Trading Platform

Alright, you're ready to jump in and practice, but where do you even start? Picking a paper trading platform is a bit like choosing your first car. They all get you on the road, but some have more horsepower, better handling, or just a dashboard that makes sense to you.

Not every simulator is built the same, and the one you pick will absolutely shape how you learn. The goal is to find a platform that clicks with what you want to achieve. Are you just trying to get the hang of buying and selling stocks? Or are you aiming higher, wanting to test-drive complex options strategies with professional-grade tools?

What To Look For In A Simulator

As you shop around, there are a few features that are non-negotiable. First and foremost, you need real-time or near-real-time market data. Practicing with prices from 20 minutes ago is like trying to learn baseball with a massive video delay – it’s just not going to prepare you for the real game.

Next, look at the variety of assets available. Some simulators are pretty basic and only offer stocks. Others let you experiment with everything from crypto and forex to options and futures. A clean, intuitive interface is also huge. You want to spend your time learning how to trade, not getting frustrated with confusing menus.

Finally, don't forget the fun factor! Exploring different trading games can be a surprisingly effective way to build your skills. For a deeper look, check out our guide on the 2024-2025 must-have stock market games for traders.

A high-quality platform like TradingView will give you an interface packed with powerful charting tools for analyzing market movements.

Getting comfortable with powerful charts like this is key. It allows you to practice technical analysis, a core skill for countless professional traders.

Top Paper Trading Platforms For Beginners

To help you narrow down the options, I've put together a quick comparison of a few popular platforms that are great for beginners. Each has its own strengths, so think about which one aligns best with your learning style.

Platform Best For Key Feature
TradingView Charting and social trading Incredible, easy-to-use charts and a huge community.
thinkorswim Serious, in-depth strategy testing Professional-grade tools that mimic a real brokerage desk.
eToro Beginners interested in copy trading Simple interface and the ability to simulate copying pros.

Ultimately, choosing the right tool is your first real trade, so don't rush it. Take a couple for a spin, see what feels right, and pick the one that makes learning feel less like a chore and more like a game you’re determined to win.

Your First Paper Trade in Four Easy Steps

Ready to jump in? Getting started with paper trading is a lot simpler than most people think. We'll walk you through it, step-by-step, so you can place your first practice trade in just a few minutes.

The whole point is to make this process feel welcoming, not intimidating. This infographic breaks down the basic flow, from picking your platform to making that first move.

Infographic showing a three-step process: 1. Choose a paper trading platform, 2. Explore the dashboard and tools, 3. Execute your first practice trade.

As you can see, you don't need a massive instruction manual to learn the ropes. It’s all about taking one small step at a time and building up your confidence along the way.

Step 1: Pick Your Platform

First things first, you need a playground. Look back at our recommendations and choose a platform that clicks with you.

Maybe you love the slick charts on TradingView, or perhaps the professional-grade tools on thinkorswim catch your eye. There’s no wrong answer here – just find one you genuinely enjoy using.

Step 2: Create Your Virtual Account

Got your platform? Great. Now, sign up for your free virtual account. This is usually a quick, five-minute process that just needs an email.

Once you're in, the platform will typically drop a hefty sum of virtual cash into your account, often $100,000, to get you started.

Step 3: Explore the Dashboard

Hold on – don't start buying just yet. Take a few minutes to get your bearings.

Click around the dashboard, play with the charting tools, and locate the buy and sell buttons. Getting comfortable with the layout now will save you from fumbling around later when you need to act fast.

Step 4: Place Your First Practice Trade

Alright, it's go-time. Pick a company you already know and are interested in, like Apple (AAPL) or Nike (NKE), and place your first trade.

The most important part? Treat this virtual money like it’s real. This single habit will help you build the right mindset from day one.

Common Paper Trading Mistakes and How to Avoid Them

A person looking at a downward-trending stock chart with a concerned expression.

Paper trading is an incredible tool, but it's far from a perfect mirror of the real market. Think of it like a flight simulator – it teaches you the controls, but it can't replicate the feeling of hitting real turbulence. The biggest trap is that without any real skin in the game, it's easy to develop some seriously bad habits.

The number one pitfall? The complete absence of real emotions. You simply don't feel that gut-punch of panic on a losing trade or the electric thrill of a big win when you’re not risking actual money. This emotional disconnect often leads to a false sense of security, encouraging you to make reckless bets you’d never dream of with your own savings.

"The four most dangerous words in investing are: 'This time it's different.'" – Sir John Templeton

This classic quote perfectly nails the overconfidence that can build up. A few lucky wins with fake money might make you feel like a market wizard, but the real market has a way of humbling everyone.

Treating It Like a Game Instead of Training

It’s tempting to start making huge, unrealistic bets just for the fun of it – a "Monopoly money" mindset. While entertaining, this is a massive mistake. The goal here isn't to get the highest score; it's to build real-world discipline and test strategies that will actually work.

To sidestep this, you have to treat it like serious training. Here’s how:

  • Set Realistic Capital: Forget the default million-dollar account. Knock your virtual balance down to an amount you would genuinely invest, whether that's $1,000 or $5,000.
  • Factor in Trading Costs: Most simulators conveniently ignore commissions and fees. Manually deduct a few dollars for each trade to see how those costs eat into your profits.
  • Keep a Trading Journal: Don't just click buttons. For every trade, write down why you made it. This forces you to be strategic rather than just gambling.

While paper trading can't fully capture the emotional rollercoaster, it's fantastic for nailing the technical side of things. Modern platforms mimic real-time price action and market depth, which is a huge advantage for sharpening your execution skills before you put cash on the line. Pros use these simulators all the time to refine their strategies without risk.

Ultimately, your success hinges on how seriously you take the simulation. Use it to forge a solid plan and cultivate discipline, and you'll be far better prepared for what the real markets throw at you. A great next step is to explore our guide on how to backtest trading strategies to further strengthen your approach.

Got Questions? Let's Get Them Answered.

If you've still got a few questions buzzing around, you're in the right place. Let's walk through some of the most common things new traders ask when they first hear about paper trading.

Is Paper Trading Really Free?

Yes, it absolutely is. The big brokerage platforms like TD Ameritrade and E*TRADE offer paper trading accounts at no cost. Even popular charting sites like TradingView have free versions.

Why? It’s simple: they want you to get comfortable with their platform. If you learn the ropes with them, you're much more likely to stick around when you're ready to put real money on the line. Bottom line: you should never have to pay for a basic paper trading account.

Can You Make Real Money From Paper Trading?

Nope, you can't cash out your paper profits. Since you're using virtual money, any gains you see are just part of the simulation. Think of it less like a job and more like an education.

The real "profit" you're making is in knowledge, experience, and confidence. Those are priceless assets when it's time to invest your hard-earned cash. As the legendary investor Warren Buffett put it, "The most important investment you can make is in yourself." Paper trading is a direct investment in your financial education.

How Long Should I Paper Trade?

There isn't a magic number, but a good rule of thumb is to practice for at least one to three months. The goal isn't just about marking days on a calendar – it's about hitting key milestones.

Before you even think about going live, you should be able to:

  • Navigate your trading platform like the back of your hand.
  • Build a clear, written-down trading plan.
  • Actually follow that plan, day in and day out, for weeks.

You’re trying to prove to yourself that you have the discipline to make smart decisions when there’s zero pressure. Once you can do that consistently, you might just be ready for the real deal.


Ready to start your learning journey? The Finance Illustrated Trading School offers free, bite-sized lessons to build your skills in just 60 minutes. Practice what you learn with fun simulators and become a more confident trader today. Explore our free resources.

What Is Market Capitalization? A Simple Guide

ye

Ever wonder how a company like Tesla or Nike gets a price tag worth billions? It all comes down to a simple idea called market capitalization, or 'market cap' for short. Think of it as the stock market's real-time vote on a company's total worth.

What Is Market Capitalization, Really?

Imagine a company is a giant pizza, cut into millions of tiny slices. Each slice is a single share of the company's stock. Market cap is just the total cost to buy up every single slice at its current price.

It’s the big, flashy number you hear on the news that tells you a company's total value, at least according to what investors think it's worth right now.

Image

Let's get one thing straight: market cap isn't about how many buildings a company owns or how much cash it has. It's a living, breathing number that changes every second the stock market is open. If the share price goes up, the market cap follows. If it drops, so does the market cap.

A Look at the Big Picture

This concept is huge – literally. When you add up the market cap of all publicly traded companies, the figure is mind-blowing. Recently, the global market cap was around $114.46 trillion USD. To put that in perspective, if you spent $1 million every day, it would take you over 300,000 years to spend that much! You can read more about these global market trends to see the full scale.

So what does this giant number mean for you?

Knowing a company's market cap helps you understand its size and where it might fit into your personal investment strategy. As the legendary investor Peter Lynch famously said, "Know what you own, and know why you own it." Getting a handle on market cap is your first step.

Market capitalization is the simplest way to gauge a company's size from an investor's point of view. It lets you quickly sort the giants from the up-and-comers.

To bring back the pizza analogy one last time: market cap tells you the value of the entire pizza, not just one slice. This is the core idea you need before we dive into the numbers and what they mean for your financial journey.

The Simple Math Behind Market Cap

You don't need to be a math whiz to figure out market capitalization. The calculation is surprisingly simple. There's no complex algebra, just one basic multiplication that gets you started.

A person using a calculator with financial charts in the background, illustrating the simplicity of market cap calculation.

The formula is as easy as it gets:

Market Cap = Current Share Price × Total Number of Outstanding Shares

That’s it! The “Current Share Price” is what one share costs on the stock market right now. The “Total Number of Outstanding Shares” represents all the slices of the company's "pizza" owned by investors, from huge funds to regular people like you.

How to Calculate Market Cap in the Real World

Let's try this with a company everyone knows: Apple. Actually doing the math yourself is the best way to make the concept stick.

Here’s how you’d do it, using some recent numbers for Apple (ticker symbol: AAPL):

  1. Find the Current Share Price: A quick search shows Apple's stock is trading at, let's say, $210 per share.
  2. Find the Outstanding Shares: Next, you find out Apple has about 15.3 billion shares out there. This is public info you can easily find online.
  3. Do the Math: Now, you just multiply those two numbers.

The calculation looks like this: $210 (Share Price) × 15,300,000,000 (Shares) = $3.21 trillion.

And just like that, you’ve calculated Apple’s market cap! This simple equation is how analysts and investors get those massive valuations. You can do this for any public company, from your favorite gaming brand to the tech giant that made your phone. It's the first step to understanding the true scale of a business.

How Market Cap Sorts Companies by Size

Ever wonder how Wall Street makes sense of thousands of companies? One of the simplest yet most powerful tools is market capitalization. Think of it like a boxing league. Market cap sorts companies into different weight classes, giving investors a quick snapshot of the kind of "fighter" they're looking at.

This isn't just a label – it's a crucial first look. It gives you immediate clues about a company's stability, growth potential, and risk. It's one of the first things experienced investors check.

The Three Main Weight Classes

Just like in boxing, each category has its own vibe. The biggest companies are the heavyweight champions – powerful and established. The smallest are more like scrappy up-and-comers, full of potential but also riskier.

  • Large-Cap (Mega-Cap): These are the giants of the stock market, the household names everyone knows, like Apple, Microsoft, and Amazon. Valued at over $200 billion, they're known for their stability. They are the established champions. A fun fact: the first company to ever hit a $1 trillion market cap was PetroChina in 2007, but Apple was the first U.S. company to do it in 2018.
  • Mid-Cap: Think of these as the rising contenders. Valued between $2 billion and $10 billion, they are established companies with proven business models but still have plenty of room to grow. Companies like Domino's Pizza or Williams-Sonoma fit in here.
  • Small-Cap: These are the energetic newcomers. Usually valued under $2 billion, these companies are often younger and operate in new or niche industries. They bring higher risk but also the potential for explosive growth.

This infographic lays out the basic hierarchy of these market cap categories perfectly.

Infographic about what is market capitalization

As you can see, the scale difference between a small-cap business and a large-cap titan is massive.

To help visualize the differences, here’s a quick breakdown of what you can generally expect from each category.

Market Cap Categories Compared

Category Typical Market Cap Example Company Key Trait
Large-Cap Over $200 Billion Apple Inc. Stability & Dividends
Mid-Cap $2 Billion – $10 Billion Domino's Pizza Growth Potential & Stability
Small-Cap Under $2 Billion (Varies, often emerging) High Growth Potential & Higher Risk

This table highlights the core trade-offs. Choosing a large-cap stock is often a bet on stability, while investing in a small-cap is a bet on the future.

Ultimately, understanding these categories helps you manage your expectations and align your investments with your personal financial goals. Each "weight class" plays a very different, but important, role in the vast world of investing.

How Legendary Investors Use Market Cap

https://www.youtube.com/embed/w5gyyx2S5Ow

For the pros, market cap isn't just a simple label – it's a powerful tool they use to take the market's temperature. Legendary investors don't just look at one company's valuation. Instead, they zoom out and use market cap to see the bigger picture, helping them decide when to be bold and when to play it safe.

One of the most famous examples comes from Warren Buffett, arguably one of the most successful investors in history. He didn't become a multi-billionaire by accident. He relies on a clever, big-picture metric that uses market capitalization to guide his major investment decisions.

The Famous Buffett Indicator

Buffett popularized a simple yet powerful concept now known as the "Buffett Indicator." It's a reality check for the entire stock market.

The indicator compares a country's total stock market capitalization to its economic output, or Gross Domestic Product (GDP). This helps answer a crucial question: Is the market getting overheated and expensive, or is it trading at a reasonable level?

This 30,000-foot view tells investors if stock prices are running way ahead of the actual economy. The Buffett Indicator essentially divides a country's total market cap by its GDP to get a ratio. In the United States, the Wilshire 5000 index is often used to represent the total market cap, since it includes thousands of U.S.-based companies.

"The price is what you pay. The value is what you get." – Warren Buffett

This classic Buffett quote perfectly captures the spirit of the indicator. It encourages investors to look past the day-to-day noise and focus on the fundamental value of the market as a whole.

This kind of analysis shows that market cap is so much more than one company's price tag; it can be a vital sign for the health of an entire economy. Professionals take this even further, using market trends for forecasting and planning. Many rely on specialized finance FPA data analysis tools for forecasting and scenario planning to make informed decisions.

By understanding how the best in the business use this metric, you can start to think like a pro yourself.

A Global View of Market Capitalization

Market capitalization does more than just tell you a company's size; it paints a fascinating picture of economic power on a global scale. Think of it as the world's economic scoreboard.

For a long time, the stock market game was dominated by just two heavyweights: first the United Kingdom, and then, decisively, the United States.

A world map with glowing nodes over major economic centers like the US, China, and Japan, representing global market capitalization.

That trend has only accelerated. The U.S. market has grown so massive that its total value now makes up roughly half of the entire world's market capitalization. It's a staggering figure. For over 250 years, global market dominance has largely belonged to these two countries. You can dig deeper into this history and the dominance of the Anglo countries on finaeon.com.

The Shifting Balance of Power

But the story is always changing. The rise of China's market, especially since the 2000s, has been incredible. It has shot up the ranks to become a major player, showing just how fast economic tides can turn. And let's not forget other giants like Japan, which also plays a crucial role in the global financial arena.

This dynamic view helps you see the stock market not as a static list of companies, but as a live arena. It's a place where countries compete, economies shift, and new leaders emerge over time.

"The stock market is a device for transferring money from the impatient to the patient." – Warren Buffett

This timeless quote from Warren Buffett reminds us that market leadership can, and does, shift with long-term trends. Understanding the global market cap landscape is key to seeing these larger movements.

It helps you diversify your portfolio and make smarter choices, whether you're picking individual stocks or deciding between different ways to invest. If you're weighing your options, you can explore our guide on ETFs vs. mutual funds to learn more.

Ultimately, market cap is the scoreboard for the world economy, and the game is always on.

Putting Market Cap to Work for You

Alright, so what does this all actually mean for you, the investor?

Think of market cap as your starting block, not the finish line. It’s the first piece of the puzzle that gives you context before you start digging deeper.

A massive market cap doesn't automatically scream "great buy," just like a tiny one doesn't mean "bad bet." It's purely a measure of size. Taylor Swift has a colossal global brand, but that doesn't guarantee her next album will be a chart-topper – it just means a lot of people are paying attention. Market cap is the same deal.

Market cap tells you how big a company is, not how good it is. It’s a tool that helps you ask the right questions, not a crystal ball that spits out all the answers.

A Quick Checklist for Getting Started

As you begin to explore stocks, keep these simple ideas in your back pocket. This isn't about a secret formula; it's about building smart habits from day one.

  • Size vs. Story: What does the market cap tell you about the company's scale? Now, does its story – its growth potential, industry, and products – actually justify that size?
  • Context is Everything: How does this company stack up against its direct competitors? Is it a giant in a small niche, or a small fish trying to survive in a huge pond?
  • Does It Fit Your Portfolio? How would a company of this size fit into your broader investment strategy? If you're building a balanced approach, check out our guide on how to diversify an investment portfolio.

Using market cap as your initial filter helps you move forward with more confidence, making smarter, more informed decisions on your investment journey.

Answering Your Market Cap Questions

Let's clear the air and tackle some of the most common questions about market capitalization. Think of this as a quick FAQ to connect the dots and clear up any confusion.

Does a High Market Cap Mean It's a "Good" Company?

Not necessarily. A high market cap tells you one thing: the company is big and likely a household name. But that’s it. It’s not a guarantee of future growth, nor does it mean the stock is a smart buy right now.

Think of it like a Hollywood blockbuster. A massive budget and A-list stars don't automatically make it a great film. Sometimes, the small indie flick (your small-cap stock) is the one that wins all the awards and delivers surprising returns.

Market cap is your starting point for research, never the final answer. It gives you context on size, but you still have to dig into the company’s financial health and growth potential.

Market Cap vs. Enterprise Value

This one trips people up, but the difference is actually pretty simple. Market cap is just the total value of a company’s stock. Enterprise value gives you a fuller picture by including debt and subtracting cash.

Let's use a housing analogy:

  • Market Cap: This is like the sticker price of the house.
  • Enterprise Value: This is the sticker price, plus the mortgage you have to take over, minus any cash you find stashed under the floorboards. It's the true cost to own the whole thing.

Does Market Cap Change Every Day?

Absolutely. In fact, it changes every second the stock market is open.

Because market cap is calculated using the live stock price, it’s constantly moving as investors buy and sell shares throughout the day. A company’s valuation can easily swing by billions of dollars in a single trading session.


Ready to put this knowledge into practice without risking a dime? Head over to financeillustrated.com to check out our free trading simulators and fun, bite-sized lessons. Start learning on financeillustrated.com today

Ask Price vs Bid Price: Your Ultimate Guide to Trading

ye

Ever looked at a stock and seen two prices? Welcome to the club. When you first get into trading, you'll see a bid price and an ask price for everything, from stocks to crypto. The difference is super simple once you get the hang of it.

The ask price is the lowest price a seller is willing to accept for their asset. Think of it as the "sticker price." On the other side, the bid price is the highest price a buyer is willing to pay for that same asset. As a trader, you almost always buy at the ask price and sell at the bid price.

What Are Bid and Ask Prices in Trading?

Imagine you're trying to sell a limited-edition sneaker. You list it for $500 – that's your ask price. At the same time, someone out there is offering to buy that exact sneaker for $475. That's their bid price. The stock market is basically a massive, lightning-fast version of this.

The ask price is always higher than the bid price. It's a constant, silent negotiation. The seller wants the most money possible (the ask), and the buyer wants to pay the least (the bid).

Bid and Ask Explained

When you hit the "buy" button on a stock, you agree to pay a price close to the current ask. When you decide to sell, you get a price near the current bid. That small gap between the two is called the spread, and it's how brokers and market makers make their money.

This visual gives you a clear look at how these two prices show up on a trading platform.

Infographic about ask price vs bid price

As you can see, the ask price always sits above the bid. If you're looking to brush up on more trading terms, a good comprehensive financial glossary can be a huge help.

For huge companies like Apple (AAPL), the spread can be tiny – sometimes just a penny – because millions of people are buying and selling all the time. For less popular assets, that gap can be much wider.

Quick Comparison of Bid vs Ask

Here's a simple table to break down the key difference between bid and ask prices from your perspective as a trader.

Concept Bid Price Ask Price
Who sets it? The buyer The seller
What does it represent? The highest price someone is willing to pay The lowest price someone is willing to accept
Your action This is the price you sell at This is the price you buy at
Relative Value Always lower than the ask price Always higher than the bid price

Ultimately, understanding this simple relationship is your first step to navigating the market. It dictates the price you pay and the price you get, forming the foundation of every trade you'll ever make.

Understanding the Bid-Ask Spread

So, you have the bid price (what buyers will pay) and the ask price (what sellers want). That little gap in between? That's the bid-ask spread. It’s not just empty space; it’s the engine room of the market and how brokers earn a small profit on every trade.

Diagram showing the bid and ask prices with a gap labeled as the spread

Think about it like changing money at an airport. They'll buy your dollars for one price (their bid) but sell you euros for a slightly higher price (their ask). That tiny difference is how they make money. The bid-ask spread in the stock market works the exact same way.

“The stock market is filled with individuals who know the price of everything, but the value of nothing.” – Philip Fisher

Getting a handle on the spread helps you see the true cost of placing a trade. It’s an invisible fee, baked right into the price of every transaction.

Why the Spread Matters to You

The size of the spread is like a health check for a stock. A tight spread – meaning a tiny gap between the bid and ask – is a fantastic sign. It usually means the stock is heavily traded, making it easy to buy or sell without your order messing with the price. You'll see this with giants like Amazon or Tesla.

On the other hand, a wide spread can be a red flag. It suggests there aren't many buyers and sellers, which can make getting a fair price a real headache. This is common with smaller companies or when the market gets spooked.

Here's what the spread is really telling you:

  • Liquidity: A tight spread screams high liquidity (easy to trade). A wide spread signals the opposite.
  • Volatility: Spreads can get wider during major news events, reflecting higher risk.
  • Trading Costs: Every time you trade, that spread is a cost you pay. For active traders, these small costs can seriously add up and eat into your profits.

Ultimately, paying attention to the difference between the ask and bid price is more than just looking at numbers. You're getting a real-time report card on a stock's popularity and your actual trading costs.

Why Bid and Ask Prices Constantly Change

If you've ever watched a live stock chart, you've seen it: the bid and ask prices flicker non-stop. This isn't random noise. It's the market's heartbeat, the result of a constant tug-of-war between supply (sellers) and demand (buyers).

Think of it like an auction. When lots of people want to buy something, they start offering more money, pushing the bid price up. Sellers see this and raise their prices, pulling the ask price up too. If bad news hits and everyone wants to sell, they lower their prices to get out fast. This makes the ask price drop, dragging the bid price down with it.

What Makes the Market Move

So, what causes these sudden shifts? A few key things are almost always behind the action. Getting a feel for them is key to seeing the bigger picture.

  • Breaking News: A company announcing a cool new product can start a buying frenzy in minutes.
  • Company Earnings: A great earnings report can send a stock soaring. A bad one can cause it to crash.
  • Economic Data: Big-picture news on things like inflation or jobs can shake the whole market.
  • Social Media Hype: Never underestimate the power of a single tweet. A message from an influential figure like Elon Musk can create massive, instant demand. A funny fact: in 2021, Musk's tweets about Dogecoin sent its price flying over 400% in a week.

Each of these events changes how investors feel about an asset's future. Their collective buying and selling is what moves the bid and ask prices in real-time. To see how these ideas apply globally, our guide on what influences exchange rates is a great next step.

“The key to making money in stocks is not to get scared out of them.” – Peter Lynch

This classic quote perfectly captures how emotional reactions to news are what fuel most of the market's short-term swings.

Today, this process is supercharged by high-frequency trading (HFT) algorithms. These aren't people clicking buttons; they're powerful computer programs that scan the news and make trades in millionths of a second, which is why prices adjust almost instantly.

How to Place Smarter Trades Using Bid and Ask

Okay, you get the theory behind ask price vs bid price. Now it's time to actually use that knowledge to make smarter moves. This is where you go from being a spectator to a player with a game plan. It all comes down to how you place your trades.

A person analyzing stock charts on a computer screen, looking thoughtful and strategic.

You have two main tools: market orders and limit orders. Think of them as a choice between speed and precision. One gets you in the game now, the other lets you set the rules.

Market Orders for Speed

A market order is the simplest way to trade. You’re telling your broker, "Get me this stock right now at the best available price." When you buy, your order will be filled at or near the current ask price. When you sell, you'll get a price close to the bid price.

This is perfect when your top priority is getting the trade done immediately. You aren't worried about a few pennies – you just want in or out, fast.

Limit Orders for Control

A limit order, on the other hand, puts you in the driver's seat. Instead of taking whatever the market offers, you set the exact price you're willing to pay or accept. For example, you could set a limit order to buy a stock only if it drops to $50.05, or to sell it only if it climbs to $52.50.

Using a limit order is your best defense against paying more than you planned. It ensures your trade only happens at your price or better.

This approach gives you total control. The downside? If the stock never hits your price, your order might sit there unfilled.

So, when do you use which? Here’s a quick guide:

  • Use a Market Order if: You’re trading a popular stock with a tight spread and you need to get the trade done instantly.
  • Use a Limit Order if: You have a specific entry or exit price in mind, or if you're dealing with a less-traded stock with a wide spread.

Getting comfortable with both is a fundamental skill. To take your strategy to the next level, you might also find some great insights from these effective day trading tips. Knowing which order to use is how you turn a basic understanding of the bid-ask spread into a real trading advantage.

Bid and Ask Prices Beyond the Stock Market

The whole bid vs. ask price concept isn't just for stocks. Once you get it, you'll start seeing it everywhere in finance. It's the universal language of buying and selling pretty much any asset.

Take the huge foreign exchange (Forex) market. When you look at a currency pair like EUR/USD, the bid-ask spread is often razor-thin – we're talking fractions of a penny. That’s because countless banks and traders are constantly buying and selling, which keeps things super liquid. If you want to get into the details, our guide on how to read currency pairs breaks it down perfectly.

Commodities and Crypto Markets

This same principle powers the world of commodities. Whether it's a barrel of oil or an ounce of gold, you'll always find a bid and an ask price. Big news, like a surprise oil discovery, can make that spread widen in a heartbeat as traders scramble to react.

And yes, the same rules apply to the wild world of cryptocurrency. The bid-ask spread on a major player like Bitcoin might be pretty tight. But for a smaller, lesser-known altcoin? That spread can be huge. A wide gap is a dead giveaway for lower trading volume and higher risk. Fun fact: even celebrities get involved. When Ashton Kutcher's venture capital firm invested in a crypto project, it brought huge attention, which tightened the bid-ask spread as more people started trading it.

"The four most dangerous words in investing are: 'this time it's different'." – Sir John Templeton

This quote is a great reminder that no matter the asset – currency, commodity, or crypto – the fundamental principles of supply and demand, shown through the bid-ask spread, always apply.

Across all these markets, the core idea is the same. The bid is what buyers will pay, the ask is what sellers will accept, and the spread is the cost of making the trade happen. Grasping this simple dynamic gives you a powerful lens to view any asset you might consider trading.

Common Questions Answered

Got a few more questions rattling around? No problem. Here are some quick answers to the things new traders often wonder about.

What Is a Good Bid-Ask Spread?

Simple: a tight one. For big, popular stocks that trade millions of shares a day, the spread might only be a penny. A tiny spread is a great sign – it means the stock is super liquid (easy to get in and out of) and your trading costs are low.

On the other hand, a really wide spread should make you pause. It can be a red flag for low trading volume, wild price swings, or general riskiness.

Can I Buy at the Bid Price?

As a regular retail trader, the system is pretty set: you buy from the market at the ask price and you sell to the market at the bid price. Think of the bid price as the standing offer from buyers (like market makers) ready to take shares off your hands.

The best way to get control over your price is to use a limit order. This tells your broker the exact price you're willing to pay, giving you the final say.

Using limit orders is a smart habit that can stop you from overpaying if the price suddenly jumps right as you hit the buy button.

How Does the Spread Affect My Profit?

The spread is a direct, unavoidable cost of trading. If you buy a stock, its price has to climb higher than the spread itself just for you to break even.

This might seem small on one trade, but for active traders making dozens or hundreds of trades, these little costs can bleed you dry. They stack up fast and can take a serious bite out of your profits. Learning to minimize the impact of the spread is a key skill for any winning strategy.


Ready to put this knowledge into practice? financeillustrated.com offers a free Trading School that breaks down how markets really work. You can start with easy-to-digest lessons and then jump into risk-free simulators to build your confidence at https://financeillustrated.com.

Comparing Brokerage Fees: A Simple Guide for Young Investors

ye

Jumping into the world of investing is a thrill, but let's be honest-the fees can feel like a surprise pop quiz. In a nutshell, brokerage fees are what you pay a platform to execute your trades on stocks, ETFs, and other assets. While ads for 'zero commission' trading are everywhere, brokers still have to keep the lights on. Figuring out how they do that is the key to comparing brokerage fees like a pro.

Decoding Your Brokerage Bill

A person sitting at a desk and comparing brokerage fees on a laptop, with charts and graphs in the background, illustrating the concept of making informed financial decisions.

Think of brokerage fees like the hidden charges on a concert ticket. The ticket price is just the start; it's the service fees that can really add up. Investing works the same way. The legendary Warren Buffett built his fortune by obsessively minimizing costs to maximize his returns. His famous mantra says it all: "Rule No. 1: Never lose money. Rule No. 2: Never forget rule No. 1." While he was talking about smart investments, sidestepping unnecessary fees is a massive part of that equation.

The good news? The game has changed for the better. Just a decade ago, commissions were a huge deal, making up around 25% of how brokers were judged. Today, that number has plummeted to just 5%, mostly because free stock and ETF trades have become the industry standard.

But "free" isn't really free. Brokers now make money through other methods, like a practice called Payment for Order Flow (PFOF). You can discover more insights about US brokerage fees and how this shift has reshaped the industry.

The Main Types of Brokerage Fees at a Glance

To make sense of it all, let's break down the most common fees you'll run into. This table gives you a quick and simple explanation of what each one is and who it impacts the most.

Fee Type What It Is (Simple Explanation) Who It Affects Most
Commissions A fee you pay your broker for making a trade (buying or selling). Traders of specific assets like options or international stocks.
Spreads The tiny difference between the buying and selling price of an asset. Active traders and those investing in forex or crypto.
Account Fees Charges for just keeping your account open, like for inactivity. Investors who don't trade often or want to switch brokers.
Withdrawal Fees A charge for taking your money out of your brokerage account. Anyone who needs to access their cash from the platform.

Understanding these four core fees will put you miles ahead. It helps you look past the flashy "zero commission" headlines and see where the real costs are hiding.

The Four Main Fees Every Investor Should Know

Before you can pick the right brokerage, you’ve got to speak the language-and that means understanding fees. When you start comparing platforms, you'll run into a few key terms over and over. Getting a handle on these is the first step to making a smart choice.

Think of them as the "big four" you need to watch out for. Let's break them down so you're never caught off guard.

Commissions and Spreads: The Trading Costs

First up, commissions. This is the most straightforward fee: a flat charge you pay for making a trade. Think of it like a service fee when you buy a concert ticket online. While tons of brokers now shout about "zero-commission" stock trades, these fees are still very much alive for assets like options, mutual funds, or crypto.

Then there’s the spread, which is a lot sneakier. It’s the tiny difference between the buying price (the "ask") and the selling price (the "bid") of an asset. A broker might buy a stock for $10.00 and offer to sell it to you for $10.01. That single penny difference is the spread, and it’s how they make money on so-called "free" trades.

"Rule No. 1: Never lose money. Rule No. 2: Never forget rule No. 1." – Warren Buffett

While Buffett was talking about picking winning stocks, his wisdom applies perfectly to fees. Every penny you pay in spreads or commissions is a penny that isn't working for you. Keep that in mind, because these tiny costs add up fast.

Account and Withdrawal Fees: The Hidden Annoyances

Beyond the cost of each trade, some brokers hit you with fees just for having an account. These can feel like a penalty for not using your account in the exact way they want you to.

Here are a few common ones to look for:

  • Inactivity Fees: Some brokers will charge you if you go too long without making a trade, maybe 90 days or a year. This is a real headache for long-term, buy-and-hold investors who aren't constantly tinkering with their portfolios.
  • Account Maintenance Fees: This is a recurring charge, often billed monthly or annually, just for the privilege of keeping your account open. Thankfully, most modern online brokers have ditched this, but it’s still out there.
  • Transfer Fees: Thinking about moving your stocks to a different broker? Watch out. You could get slapped with a fee which can easily be $50-$100.

Finally, there are withdrawal fees. Yes, you read that right-some platforms charge you to take out your own money. This is more common for certain withdrawal methods, like wire transfers, but it’s always worth checking the fine print.

Knowing these four fee types is your superpower. It’s how you cut through the marketing noise and find a broker that’s truly low-cost.

How Real Brokerage Fee Structures Compare

Alright, let's get out of theory and into the real world. Comparing brokerage fees isn't as simple as finding the lowest number on a page; it's about finding the right cost structure for your specific style of investing. A cheap, no-frills broker might be perfect for one person, while another will gladly pay more for access to top-tier research and powerful trading tools.

Think of it like choosing a phone plan. One might offer "unlimited" data but slow you down after a few gigs, while another costs more but delivers lightning-fast speeds all month. Neither is objectively "better"-it all boils down to whether you're a casual emailer or a 4K video streamer. Brokerages work the same way. The goal is to match the fee structure to your actual investment habits.

Discount vs. Zero-Commission: A Practical Showdown

Let's make this real. Imagine you start with $1,000 and make five simple trades over a few months. This is where the slick marketing slogans hit a wall with reality.

  • Broker A (Discount Broker): This platform is old-school. It might charge a flat $10 commission for every trade you make. For your five trades, you'd be out a total of $50 in fees. Simple, predictable, and a bit pricey for small-time trading.
  • Broker B (Zero-Commission Broker): This one is all about "free" trades. But they have to make money somewhere, right? They do it on the spread for each trade. Let's say it works out to about $0.50 per trade. Your total cost here? A mere $2.50.

This chart really drives home how a traditional discount broker's costs stack up against a modern zero-commission model in our five-trade scenario.

Infographic about comparing brokerage fees

As you can see, for a handful of simple trades, the zero-commission model seems like a no-brainer.

This quick comparison teaches a critical lesson: headline rates never tell the full story. The legendary investor Peter Lynch famously said, "Know what you own, and know why you own it." The exact same logic applies to your broker-you need to know what you're paying for and why.

Choosing a broker is like picking a teammate for your financial journey. You want one who plays to your strengths and doesn't slow you down with unexpected penalties. The "cheapest" option on paper might not be the best fit for your game plan.

A Deeper Look at Popular Broker Models

To give you an even clearer picture, let’s dig into the common fee structures you'll find with three popular types of online brokers. This will help you see where the costs might pop up unexpectedly.

Real-World Cost Showdown: Popular Online Brokers

Here’s a side-by-side look at how different broker types structure their fees, from zero-commission apps to platforms built for active traders. Notice how the "best" choice really depends on what kind of investor you are.

Feature Broker A (e.g., Robinhood) Broker B (e.g., Fidelity) Broker C (e.g., Interactive Brokers)
Stock/ETF Commissions $0 $0 Often $0, but can have a small per-share fee
Key Revenue Source Payment for Order Flow (PFOF), subscriptions Interest on cash balances, premium services PFOF, margin interest, per-share commissions
Options Fees $0 per contract ~$0.65 per contract Tiered pricing, often lower for high volume
Account Minimum $0 $0 Often $0, but Pro accounts may have minimums
Best For New investors making simple stock/ETF trades. Long-term investors who want research tools. Active and professional traders seeking low costs.

This breakdown makes one thing crystal clear: comparing brokerage fees forces you to look way beyond a single number. The right broker for you depends entirely on how often you trade, what you trade, and what tools you need to succeed.

The Hidden Costs of 'Free' Trading

You’ve heard the old saying, right? "If something is free, you are the product." This has never been more true than in the world of 'commission-free' trading. It's a fantastic marketing hook, but it pays to be a little skeptical and ask how these brokers are keeping the lights on if they aren't charging for trades.

Let's pull back the curtain on how things really work.

A magnifying glass hovering over a stock chart, revealing hidden fee symbols like dollar signs and percentages, symbolizing the hidden costs of 'free' trading.

One of the biggest ways these brokers make money is from a practice called Payment for Order Flow, or PFOF. It sounds technical, but the idea is pretty simple. Instead of sending your "buy" order straight to the New York Stock Exchange, your broker sells it to a massive, high-speed trading firm (think Citadel or Virtu).

That big firm is the one that actually executes your trade. For the privilege of getting your order, they pay your broker a tiny fee. Think of it like a referral kickback. The catch? You might not be getting the absolute best price on your stock. It could be off by a fraction of a cent, but when you multiply that by millions of trades, it adds up to real money for them.

Margin Loans: The Sneaky Debt Trap

Another huge moneymaker is the interest charged on margin loans. Margin is just a fancy word for borrowing money from your broker to buy more stocks than you can afford with your own cash. It’s a classic high-risk, high-reward move that can magnify your gains, but it can just as easily amplify your losses.

It's a strategy so risky that even billionaire investor Mark Cuban has warned against it, famously saying, "If you're using a margin account, you're a schmuck."

The interest rates on these loans can be shockingly high and vary wildly from one broker to the next. For anyone considering trading on margin, this difference is one of the most important cost factors to compare.

A 2025 analysis revealed a massive gap in margin loan rates. For a $100,000 loan, Robinhood's rate hovered around 5.55%. In contrast, traditional brokers like Fidelity and Charles Schwab were charging over 11%-nearly double. You can learn more about how these rates impact traders here.

This huge difference in rates shows just how aggressively some of the newer platforms are competing, while older brokers often rely on more expensive fee models. If you ever plan to use margin, this "hidden" cost could easily become your single biggest expense.

Getting a handle on PFOF and margin interest is vital. It proves that even when the sticker price says "$0 commissions," trading is never truly free. Knowing how these things work lets you look past the slick marketing and choose a broker whose fee structure genuinely aligns with your trading style-not just their bottom line.

How Fees Change for Different Investment Types

Think of your brokerage account like a restaurant menu. Ordering a simple soda (like buying a popular US stock) is cheap and straightforward. But when you start looking at the more complex meals (like options or international assets), the price tag changes. This is a critical detail to grasp when comparing brokers: what you trade directly impacts what you pay.

It's a common trap for new investors. They get lured in by "zero-commission" trades on US stocks and ETFs, only to be surprised by unexpected costs when they venture into other markets.

Fees for Forex and Options Trading

If you're drawn to the fast-paced world of Forex (foreign currency) trading, you'll almost always run into a small commission on every trade. The currency market moves at lightning speed, and brokers charge this fee for executing your orders instantly. For frequent traders, even a tiny commission can stack up quickly. In fact, these rates can vary wildly across the globe depending on the currency pair. You can see how Forex commissions differ globally here.

Options trading is another beast entirely, with its own unique fee structure. Brokers typically charge a per-contract fee, which often hovers around $0.65 per contract. That might sound tiny, but for active traders juggling dozens of contracts at a time, it's a major cost to factor in. This model is completely different from the flat-fee or zero-commission structure you find with stocks.

The Special Case of Mutual Funds

Mutual funds have long been a go-to for long-term investors, but they come with a sneaky internal fee known as the expense ratio. This isn't a fee you pay upfront when you click "buy." Instead, it's quietly deducted from the fund's assets every single year.

The expense ratio is like a slow leak in your tire-you might not notice it day-to-day, but over a long journey, it can seriously deflate your performance. A 1% expense ratio on a $10,000 investment will cost you $100 every single year, whether the fund makes money or not.

This hidden cost is exactly why comparing individual funds is just as crucial as comparing brokers. You can learn more about the differences between ETFs and mutual funds in our article and see how their fee structures really stack up.

Ultimately, understanding that different investments have different pricing models is the key to avoiding nasty surprises and keeping your trading costs under control.

Choosing the Right Broker for Your Investing Style

A young person looking at a checklist on a tablet, with financial charts in the background, making a decision about which broker to choose.

Alright, it’s time to pick your financial partner. After digging into brokerage fees, you've probably figured out that the cheapest option isn't always the right one. The most critical factor, by a long shot, is your personal investing style.

Are you aiming to be a long-term, "buy-and-hold" investor in the mold of the legendary Warren Buffett, who famously trades only when the stars align? Or are you more of an active trader, ready to pounce on market moves? Your answer changes everything.

"I will tell you the secret to getting rich on Wall Street. You try to be greedy when others are fearful. And you try to be fearful when others are greedy." – Warren Buffett

Buffett's quote is about psychology, but it also reveals a strategy. A patient investor who makes a handful of smart decisions each year has completely different needs than someone trading daily. Your broker needs to match your game plan, not fight against it.

A Quick Checklist for Choosing Your Broker

To find the perfect fit, you need to ask yourself a few key questions. This simple framework will help you cut through the marketing noise and make a smart, personalized decision.

  • How often will I trade? If you're planning to trade multiple times a week, a broker with low or zero commissions and tight spreads is non-negotiable. For infrequent investors, a slightly higher per-trade cost might be perfectly fine if the platform offers better long-term tools.
  • What tools and research do I need? Are you a beginner who just needs a simple buy button, or are you hungry for advanced charting software and in-depth analyst reports? Don’t pay for bells and whistles you’ll never use. Many investors find a free online stock trading course gives them a solid foundation before they ever need to pay for premium tools.
  • What is my long-term goal? Is this for retirement, passive income, or something else entirely? As you compare brokers, look for those that offer comprehensive resources, like strategies for building a retirement stock portfolio. Your broker should support your ultimate financial destination.

Your goal is to find a broker that feels like a true partner on your financial journey-not just another monthly expense. This checklist makes that process a whole lot simpler.

Brokerage Fees: Your Questions Answered

Got a few lingering questions before you jump in? Perfect. Let's clear up some of the common things that trip up new investors when it comes to brokerage fees.

Can I Really Invest with Absolutely Zero Fees?

In short, not really. While tons of brokers shout from the rooftops about commission-free stock and ETF trades, it's almost impossible to invest without ever paying something.

Think of it like a "free" game on your phone-sure, the download costs nothing, but you know there are in-app purchases waiting. For brokers, the costs are just less obvious. They might make money from the spread (the tiny difference between the buy and sell price) or through something called Payment for Order Flow (PFOF).

Always hunt down the full fee schedule on a broker's website. You'll usually find it tucked away in the footer under "Pricing" or "Commissions."

Does a Broker with Higher Fees Mean It's Better?

Not necessarily. Sometimes, higher fees just mean you're paying for a bunch of premium services you'll never use, like personal financial advisors or super-complex research tools. If you're just getting started, a simple, low-cost platform is almost always the smarter move.

Even legendary basketball star LeBron James is famous for his financial discipline, once saying, "We are not throwing money to the ceiling." Your goal is the same: keep as much of your money as possible working for you. That starts by cutting out unnecessary costs.

A classic rookie mistake is paying for features you don’t use. If your plan is just to buy and hold a few ETFs, you don’t need a platform built for a high-frequency day trader-one that might hit you with higher account maintenance fees for those bells and whistles.

Choosing the right broker isn't about finding the one with the most features. It's about finding the one whose costs actually align with your simple, straightforward goals. Start small, keep it cheap, and build from there.


Ready to build your trading knowledge without the confusing jargon? At Finance Illustrated, we offer free, easy-to-understand lessons and simulators to get you started. Begin your trading education journey with us today!

A Beginner’s Guide to Buy and Hold Investing

ye

The buy and hold strategy is super simple at its core. You buy investments – like stocks or funds – and you just hang onto them for a long time. We're talking years, or even decades.

The whole point is to stop stressing about the stock market's daily drama. Instead, you let your investments grow steadily over time, rather than trying to perfectly guess every up and down for a quick win.

What Is Buy and Hold Investing?

Imagine planting an oak tree. You don’t dig it up every week to check the roots, right? You give it water and sun, and you trust the process. That's the buy and hold idea in a nutshell. It's a patient, long-term game where you learn to ignore the market's daily mood swings.

Instead of trying to outsmart everyone, you focus on buying into solid, quality companies and letting them do the hard work for you. It’s no surprise that legendary investor Warren Buffett, one of the richest people on the planet, is a huge fan of this method.

He famously said:

"Our favorite holding period is forever."

This simple quote changes your role completely. You stop being a frantic trader glued to a screen and start acting like a business owner. You're not just buying a random stock symbol; you're buying a small piece of a real company, betting on its success over many years.

The Power of Time and Compounding

The real secret sauce behind buy and hold is something called compound interest. It's the magic that happens when your investment earnings start making their own earnings.

Picture a snowball rolling down a hill. It starts small, but as it rolls, it picks up more snow, getting bigger and bigger, faster and faster. That's your money at work.

This chart shows just how powerful that effect can be. It pictures how a single $1,000 investment could blossom with an average 8% annual return over 20 years.

Infographic about buy and hold

Notice the growth isn't a straight line. It curves up, speeding up as time goes on and your money starts making more money for you. That's compounding in action.

How It's Different from Day Trading

To really get why this calm, steady approach is so cool, let's compare it to its hyperactive cousin: day trading. Day traders jump in and out of stocks within the same day, trying to grab tiny profits from tiny price changes. It's a high-stress, high-fee game that requires you to be constantly watching the screen.

Buy and hold is the total opposite. You check in sometimes, but otherwise, you just let your strategy do its thing.

Here's a quick look at the main differences.

Buy and Hold vs Day Trading at a Glance

Feature Buy and Hold Day Trading
Time Horizon Long-term (years, decades) Super short-term (minutes, hours)
Goal Build wealth with compounding Make quick profits from price swings
Activity Level Low (you buy and… hold) Very high (lots of trades every day)
Stress Level Usually pretty low Extremely high
Fees Very few transaction costs High because of all the trading
Mindset Investor (like a business owner) Trader (like a speculator)

The two approaches couldn't be more different. One is a marathon, the other is a sprint. Buy and hold isn't about getting rich overnight. It's a proven way to build a solid financial future through discipline, patience, and the incredible power of time.

Why Patience Is Your Investing Superpower

A chart showing the exponential growth of a long-term investment over time, representing the power of compound interest.

If you only remember one thing about the buy and hold strategy, make it this: patience is everything. It's the secret ingredient that unlocks the most powerful force in finance – compound interest. Think of it like a snowball rolling downhill.

At first, it’s small. Your investment makes a little money. But then, that extra money starts earning its own money. Over decades, this cycle creates a kind of financial magic where your portfolio doesn't just grow, it accelerates. It's the ultimate “work smarter, not harder” move for your money.

“Compound interest is the eighth wonder of the world. He who understands it, earns it; he who doesn't, pays it.” – A quote often linked to Albert Einstein.

This one idea is the engine that drives the whole buy and hold philosophy. By staying in the game for the long haul, you give your money the one thing it needs most to work its magic: time.

Riding Out the Storms

Let's be real, the stock market can feel like a rollercoaster. You get the awesome climbs, but you also get the stomach-lurching drops. It's during those drops that most people make their biggest mistake – they panic and sell at the worst possible time. It’s a gut reaction, but it locks in their losses and guarantees they miss the comeback.

A buy and hold mindset is your shield against that noise. It trains you to see market downturns not as a disaster, but as a temporary dip on a much longer journey. By simply staying invested, you make sure you're around for the rebound and all the growth that comes after.

Did you know that in the past 40 years, the stock market's 10 best days happened within just two weeks of the 10 worst days? If you panicked and sold during the bad days, you almost certainly missed the huge bounce-back that followed. The lesson is clear: staying patient through the chaos pays off.

Beyond the Numbers: The Mental Edge

There's more to this than just bigger bank account balances. Using a buy and hold strategy is just a calmer, saner way to invest. It’s about winning the mental game as much as the financial one.

Here are a few of the biggest perks:

  • Lower Stress: You’re free from the pressure of daily market news. Your plan is set for years, not days, so you can focus on your life.
  • Fewer Costs: Constantly jumping in and out of the market adds up in trading fees and can create a huge tax bill. Holding on keeps those costs way down.
  • Simplicity: You don’t need to be a Wall Street genius with complicated charts. The strategy is wonderfully simple: pick good investments and give them time to grow.
  • Builds Discipline: It forces you to manage your emotions and trust your plan, which is a powerful skill that helps with pretty much everything in life.

This strategy isn't just about buying stocks; it's about buying yourself time and peace of mind. It's a disciplined approach that rewards patience and lets the incredible force of compounding build real, lasting wealth for your future.

How to Invest Like a Legend

A portrait of Warren Buffett, an iconic buy and hold investor, looking thoughtful and wise.

When you picture the world's richest investors, you might imagine frantic traders glued to screens, making risky moves every second. But the reality is often the total opposite.

Many of the greatest fortunes weren't built on speed, but on incredible patience and mastering the buy and hold strategy. By looking at their game plan, we can learn the secrets to creating lasting wealth.

There's no better example than Warren Buffett, also known as the "Oracle of Omaha." He’s a legend, not for some complex secret formula, but for a simple yet powerful philosophy. Way back in 1988, his company bought stock in Coca-Cola. They’ve held it ever since, watching that initial $1.3 billion investment grow into more than $25 billion – and that’s before you even count decades of dividend payments.

"Our favorite holding period is forever." – Warren Buffett

That one line says it all. It perfectly captures the buy and hold mindset. Buffett didn’t see a stock price; he saw a fantastic business with a timeless product. So, he bought it planning to never let go, trusting the company's long-term value to win out over short-term market drama.

You Don’t Need to Be a Billionaire

Here’s the best part: this strategy isn’t just for billionaires. It's a proven path for regular people, too.

Of course, to really invest like a legend, every decision has to be based on good reasons. This is where learning how to use data and research for evidence-based decision making becomes your superpower.

Just look at the amazing story of Ronald Read. He was a janitor and gas station attendant from Vermont who lived a simple life. No one knew he was quietly investing his small savings for decades. When he passed away in 2014, he left an $8 million fortune to his local library and hospital.

Read's story is powerful proof that you don't need a Wall Street job or a fancy degree to win with buy and hold. He simply stuck to a few core rules:

  • Live below your means: This gave him the extra cash to invest consistently over time.
  • Invest in solid, well-known companies: He bought shares in household names like Procter & Gamble, Johnson & Johnson, and JPMorgan Chase.
  • Be incredibly patient: He held onto his investments for decades, giving compound interest the time it needed to do its thing.

These legends, from the Oracle of Omaha to a Vermont janitor, show us that successful investing isn't about timing the market. It’s about having a solid plan, choosing quality investments, and having the discipline to stick with it for the long run.

How to Handle the Market's Wild Mood Swings

Let's be real – the buy-and-hold strategy isn't always a walk in the park. There will be days, weeks, or even years when the market feels like it's in a freefall. Watching your account balance drop is one of the toughest tests you'll face as an investor.

This is the moment where your emotions are pushed to the limit. Every instinct might be screaming, "SELL!" just to stop the pain. But this is exactly when the most successful investors hold on tight.

Understanding that these downturns are a normal, expected part of the journey is what separates the winners from everyone else. The market has a long history of throwing tantrums, but it also has an even longer history of powerful recoveries.

Riding Out the Financial Storms

Think back to the big ones, like the 2008 global financial crisis. Fear was everywhere. It felt like the sky was falling, and many people panicked, selling their investments at the lowest prices and locking in huge losses.

But history tells a much different story for those who stayed put. The S&P 500, a collection of the 500 biggest US companies, fell by a scary 37% in 2008. But guess what happened in 2009? It shot up by 26.5%. Patient investors who held on not only recovered but saw incredible growth in the years that followed. You can explore the S&P 500's historic performance and see this strength for yourself.

This pattern isn't a fluke; it's the market's natural rhythm. Steep drops are almost always followed by powerful recoveries.

Actionable Tips to Stay the Course

Knowing this history is one thing, but living through a downturn is another. The trick is to have a game plan before the storm hits, so you can rely on logic instead of fear.

Here are a few things you can do to keep your cool when the market gets wild:

  • Stop Checking Your Account: When the market is dropping, constantly refreshing your portfolio is like picking at a scab. It just makes it worse. Limit yourself to checking once a month – or even less – to avoid a knee-jerk reaction.
  • Remember Why You Started: Go back to your original financial goals. Are you investing for retirement in 30 years? A down payment in 10? Reminding yourself of your long-term "why" helps ignore the short-term noise.
  • Focus on What You Can Control: You can't control the stock market, but you can control your actions. Stick to your plan of investing regularly. This is called dollar-cost averaging, and it means you automatically buy more shares when prices are low – a huge advantage over time.

The legendary investor Peter Lynch had a great way of looking at it.

"The real key to making money in stocks is not to get scared out of them."

In the end, your greatest asset isn't your stock-picking skill; it's your emotional discipline. It’s not about being fearless. It’s about acting despite the fear, trusting your long-term plan, and letting time do the hard work for you.

Your Simple Guide to Getting Started

Alright, you're ready to stop learning and start doing. This is where the fun begins, and trust me, it’s way easier than you think. Getting started with a buy and hold plan is less about having a lot of money and more about taking that first simple step.

Let's break it down into a super simple, beginner-friendly launch plan.

Your First Mission: Open the Right Account

The first mission is just to open the right kind of account. Think of this like getting your driver's permit before you can hit the road – it's the first essential step.

You'll need a brokerage account, which is just a fancy name for an account that lets you buy and sell investments. You could also look into a Roth IRA if you're thinking about retirement, since it offers some awesome tax advantages later on. Many online platforms let you open one in minutes with no minimum deposit.

What Should You Actually Buy?

Okay, account open. Now what? The number of choices can feel overwhelming, but for a buy and hold strategy, the best answer is usually the simplest one. You don't need to be a stock-picking genius.

Instead, look at low-cost index funds or Exchange-Traded Funds (ETFs).

Think of an ETF as a pre-made Spotify playlist of stocks. Instead of trying to pick the single best song (stock), you buy the entire "Top 500 Hits" album at once. This gives you instant diversification, spreading your money across hundreds of companies automatically.

This is a great starting point because it protects you from the risk of one single company doing poorly. For a deeper dive into how these funds compare, you can learn more about the differences between ETFs and mutual funds in our detailed guide.

To make it even easier, here are examples of popular, diversified ETFs that are great for a new buy and hold investor.

Simple Portfolio Ideas for Beginners

ETF Ticker What It Invests In Why It's a Good Starting Point
VOO (Vanguard S&P 500 ETF) The 500 largest companies in the U.S., like Apple and Microsoft. It’s a classic for a reason. You get a piece of the core U.S. stock market.
VTI (Vanguard Total Stock Market ETF) The entire U.S. stock market – large, medium, and small companies. Even more diverse than the S&P 500, giving you a tiny piece of thousands of companies.
VT (Vanguard Total World Stock ETF) Companies from all over the world, including the U.S., Europe, and Asia. The ultimate one-stop-shop for global diversification, reducing the risk of one country's economy struggling.

These aren't specific recommendations, but they show how simple and powerful a starting portfolio can be. Just one of these ETFs can give you a massively diversified foundation.

Your Secret Weapon for Consistency

Now for the last piece of the puzzle – how to invest without stressing. The secret is a technique called Dollar-Cost Averaging (DCA). It sounds technical, but it’s incredibly simple.

With DCA, you invest a fixed amount of money on a regular schedule, like $25 every two weeks, no matter what the market is doing.

  • When prices are high, your $25 buys fewer shares.
  • When prices are low, that same $25 buys more shares.

Over time, this smooths out your purchase price and removes the temptation to "time the market." It puts your buy and hold plan on autopilot, which is exactly where you want it.

Just set it, forget it, and let time and consistency do the hard work for you. Getting started really is that simple.

Building a Stronger Portfolio with Diversification

A diverse group of puzzle pieces fitting together, symbolizing how different investments combine to form a strong, complete portfolio.

You’ve definitely heard the advice, "don't put all your eggs in one basket." It might be a cliché, but it’s the perfect way to think about diversification – and it’s a must-have for a smart buy and hold strategy.

Think of it like building a championship sports team. You wouldn't just sign a dozen star quarterbacks, would you? Of course not. You need defense, offense, and specialists, all bringing different skills to win consistently. Your investment portfolio works the same way.

Spreading your money across different types of investments is your best defense against surprises. It means owning a mix of assets, like stocks from big U.S. companies, smaller tech firms, and even international businesses. When one part of your portfolio is having a rough time, another part might be doing great, which helps smooth out the ride.

Why Spreading Out Is So Powerful

This isn't just about playing it safe; it's about giving yourself more chances to win. The economy is huge and complex, and different parts of it shine at different times. By diversifying, you make sure you have a piece of the action no matter which area of the market is leading the way.

The long-term impact of this is truly mind-blowing. One study showed that if you had invested $10,000 back in 1992 into just the S&P 500, it would have grown to about $230,000 by 2022. That's amazing! But if you had put that same $10,000 into a diversified portfolio with different types of assets, it could have grown to nearly $300,000. That's a life-changing difference.

Diversification is the only free lunch in investing. It allows you to reduce risk without sacrificing expected return.

To get the most out of your long-term plan, it helps to know how your mix of investments should change over time. Learning about different strategies for 401k asset allocation by age can give you a solid plan for building a strong portfolio. For more actionable advice, our guide on how to diversify your investment portfolio also breaks down practical steps you can take today.

Got Questions About Buy and Hold? Let's Clear Things Up.

Alright, let's tackle some of the questions that always pop up when people first hear about the buy and hold strategy. Getting these sorted out is often the last step before feeling confident enough to actually get started.

How Much Money Do I Really Need to Start?

Honestly? You can probably start with whatever you have in your pocket right now. Thanks to things like fractional shares (where you can buy just a small piece of a stock) and low-cost funds, you can get in the game with as little as $5 or $10.

The real secret isn't starting with a huge pile of cash. It's all about building the habit of investing, bit by bit, on a regular basis. Consistency is what builds wealth, not some massive one-time investment.

Ashton Kutcher, the actor and successful tech investor, once said something interesting about this. He focuses on "finding the signal in the noise," which is exactly what a consistent, automated investing plan helps you do. You ignore the daily drama and focus on your long-term plan, which is the real signal for success.

Isn't Buy and Hold… Kinda Boring?

Some people might call it boring, but I prefer to call it effective. Let's be real: investing isn't meant to be a trip to the casino. It's a powerful tool for building real financial freedom for your future.

Sure, day trading might look exciting in movies, but that "excitement" comes with a mountain of stress, tons of fees, and a much, much higher chance of losing money. Buy and hold is "boring" in the best way possible – it just works quietly in the background, growing your wealth while you live your life.

Okay, So When Should I Actually Sell?

While the whole point is to hold on for the long haul (think 10+ years), life happens. There are a few logical reasons you might decide to sell.

  • You've hit a major financial goal. This is the best reason! Maybe you've saved enough for a down payment on a house or to pay for college.
  • The fundamentals have totally changed. If the main reason you invested in a company has completely and permanently soured – say, a huge scandal or a new technology makes its business model useless – it might be time to rethink.

The one time you never sell? Just because the market took a nosedive. That's panic, not a strategy. Letting fear make your decisions is the biggest mistake a long-term investor can make.

Find Your Free Online Stock Trading Course

ye

Ever feel like the world of stock trading is some exclusive club you weren't invited to? A free online stock trading course is basically your VIP pass-it lets you learn all the rules of the game without costing you a dime. Think of it as a roadmap for turning those confusing news headlines and scary-looking charts into knowledge you can actually use.

Your Stock Market Journey Starts Here

A person working on a laptop with stock market charts in the background

Jumping into anything new, especially when it involves money, can feel a bit intimidating. You’re hit with graphs, numbers, and jargon, and it's easy to think you need a finance degree and a pile of cash just to start.

That couldn’t be further from the truth.

The reality is, anyone can learn how the stock market works. All it really takes is a bit of curiosity and access to the internet. A great free online course is built to guide you from feeling clueless to feeling confident, one simple, bite-sized lesson at a time.

Breaking Down the Basics

So, what’s really going on with the stock market? It’s a lot less complicated than it seems. When you buy a stock, you're just buying a tiny slice of a company you believe in-whether that’s Apple, Nike, or a local business that’s gone public. If that company succeeds and grows, the value of your tiny slice can grow right along with it.

It's like becoming a part-owner of your favorite brands.

A good course will clear up the fog around core concepts like:

  • Stocks and Shares: What they actually are and how they represent a piece of the pie.
  • Market Trends: How to spot patterns and understand why tech stocks might jump after a big new product launch.
  • Risk vs. Reward: Getting comfortable with the idea that the potential for big wins always comes with the possibility of losses.

If you're starting from scratch, a solid guide can really help lay the groundwork. This complete guide on how to start investing for beginners is a fantastic resource for building that initial foundation.

Why Your Age Is a Superpower

Getting a handle on investing between the ages of 16 and 18 is like getting a massive head start in a race. You have the single most powerful ingredient for financial success on your side: time. It’s a concept called compounding, where your money starts making money, and then that money starts making even more money. The earlier you start, the more powerful it becomes.

Even celebrities like Ashton Kutcher got into the game early by investing in tech startups like Uber and Airbnb, knowing that starting sooner is always better than later.

"Someone's sitting in the shade today because someone planted a tree a long time ago." – Warren Buffett

Learning about this stuff now is you planting that financial tree for your future self. A free course gives you the perfect practice field to learn the ropes without putting any real money on the line.

What to Expect From a Free Trading Course

So, what’s actually packed into a free online stock trading course? If you're picturing boring lectures that feel like a high school economics class, think again. The best courses are engaging and interactive, designed to build your skills piece by piece without throwing a textbook’s worth of jargon at you all at once.

You'll usually find a mix of learning tools that keep things interesting. Think short, easy-to-digest video lessons that break down complex ideas, quick quizzes to check your understanding, and handy cheat sheets you can download for a quick refresher later. The whole point is to make the knowledge stick.

The infographic below nails the core benefits, showing why these courses are such a fantastic starting point.

Infographic about free online stock trading course

As you can see, the blend of no-cost learning, a schedule that fits your life, and the ability to learn from anywhere is a game-changer. It completely removes the old barriers that used to keep people out of financial education.

The Most Valuable Feature: A Trading Simulator

If there’s one feature that truly stands out in a good free course, it’s the trading simulator. Honestly, think of it as a video game for Wall Street. You get to play with a big pile of fake money, buying and selling real stocks at their actual, live prices-all inside a totally risk-free sandbox.

This is where all the theory you've been learning gets real. It's your chance to experiment with different strategies, see firsthand how a news headline can send a stock soaring or sinking, and experience the emotional rollercoaster of trading without risking a single dollar. It's just like a flight simulator for a pilot-you wouldn't want them learning the ropes in a real jumbo jet, would you?

"The best investment you can make is in yourself." – Warren Buffett

A free course is exactly that-an investment in your financial literacy that costs you nothing but your time. Billionaire Mark Cuban is another huge believer in self-education, often talking about how he reads for hours every day to stay sharp. This is your first step toward building that same kind of knowledge advantage.

Core Components You Will Find

To give you a clearer picture, let's break down the essential building blocks you'll find in most quality courses. They’re all designed to work together, guiding you from basic concepts to hands-on practice in a logical way.

Here’s a quick look at the essential features you'll find in most quality free online stock trading courses.

Core Components of a Free Trading Course

Component What It Is Why It Matters for You
Video Modules Short, focused video lessons, usually 5-10 minutes long, that cover one specific topic at a time (e.g., "What is a Stock?"). Makes learning digestible and easy to fit into a busy schedule. You learn one concept well before moving on to the next.
Interactive Quizzes Brief quizzes that pop up after a video or module to test what you just learned. These aren't for a grade! They help reinforce the key takeaways and show you if you need to re-watch a lesson.
Trading Simulators A virtual trading platform where you can practice buying and selling stocks with "play" money. This is where you connect theory with action. It builds confidence and lets you make mistakes without any real-world consequences.
Downloadable Resources Extra materials like PDF cheat sheets, checklists, and glossaries of common trading terms. These are your go-to references. You can save them and look back anytime you need a quick reminder, long after the course is done.

These components create a well-rounded learning experience that’s much more effective than just reading a book or watching random videos online. It's a structured path designed for beginners.

Picking the Right Course for You

Googling "free online stock trading course" can feel like opening a fire hose. You're suddenly flooded with options, and it's tough to tell which ones are genuinely helpful and which are just a waste of time. But don't sweat it. Think of this as your guide to finding a real gem.

Putting in a little effort now to find the right fit makes a huge difference. You're way more likely to stick with it, actually enjoy the process, and build skills that can serve you for the rest of your life.

Who's Behind the Curtain?

First things first: who’s actually teaching you? You wouldn't learn to fly a plane from someone who's only read about it in a book. The same logic applies here. Look for courses created by respected financial education companies, well-known trading communities, or even top-notch universities.

For instance, Yale University’s "Financial Markets" course on Coursera is a great example. It offers about 33 hours of beginner-friendly content that walks you through everything from basic pricing to forecasting. It shows that even Ivy League schools are breaking down old barriers. To see how other top universities are getting in on this, you can learn more on StockGro.

Check the Syllabus and See What Others Are Saying

Before you hit "enroll," always take a look at the syllabus. It's just a roadmap of what you’ll be learning. Does it cover the topics you’re curious about? Does it start with the basics before diving into the deep end? A good beginner course won't throw complicated strategies at you in the first lesson.

Next, play detective and read the reviews. Real student feedback is gold. It’s like getting a tip from a friend who’s already been there. Keep an eye out for comments on:

  • Clarity: Was the material easy to follow, or was it a snooze-fest of jargon?
  • Engagement: Did people find it interesting enough to finish?
  • Practical Tools: Does it come with a trading simulator so you can practice without risking real money?

A few minutes spent reading reviews can save you hours of frustration with the wrong course.

"An investment in knowledge pays the best interest." – Benjamin Franklin

Ben Franklin was onto something. Choosing a quality course is your very first investment, and it's arguably the most important one you'll make.

Find a Course That Fits Your Vibe

Lastly, be honest about how you learn best. Are you a fan of quick, bite-sized videos you can watch during a break? Or do you prefer to settle in and really dig into longer, more detailed explanations?

There’s no one-size-fits-all answer here. Some courses are built for speed, while others are paced more like a traditional class. Picking one that matches your personal style will make learning feel less like a chore and more like an exciting new adventure.

The Real-World Impact of Free Education

So, does taking a free course actually make a difference? You bet it does. Think about it-just a few years ago, learning to trade stocks felt like trying to get into an exclusive club with a steep cover charge. You needed a hefty bankroll just to get your foot in the door.

That world is history. Today, a free online stock trading course is bulldozing those old barriers. This massive shift means your curiosity, not your cash, is your ticket to entry. It’s a game-changer that's opening up the world of investing to a whole new generation.

Leveling the Playing Field for Everyone

For a long time, financial knowledge was something you inherited or paid a small fortune for at a university. Now, it's accessible to anyone with an internet connection. This has created a much more diverse market, where fresh ideas can come from literally anywhere.

Take platforms like Bullish Bears, for example. They've built their entire mission around making trading education available to everyone, offering free classes on everything from day trading to options with a simple sign-up. In fact, some reports estimate that around 90% of retail traders get their start with free resources before ever paying for more advanced training.

This new reality is proof that you don't need a fancy degree to build a valuable skill. All it really takes to get started is your time and a genuine desire to learn.

Knowledge Is Your Foundation, Not a Guarantee

Alright, so will finishing a free course turn you into the next Warren Buffett overnight? Let’s get real-probably not. Think of the course as your launchpad. It gives you the foundational knowledge and essential tools, like a trading simulator, to start building your skills without risking your own money.

But here’s the thing: success in trading is about more than just reading a stock chart. It’s about mastering your own psychology. A ton of data shows that most beginners stumble not from a lack of knowledge, but because they can't keep their emotions in check when real money is on the line.

"In this business if you’re good, you’re right six times out of ten. You’re never going to be right nine times out of ten." – Peter Lynch

This is such a crucial point. A free course trains your brain, but you have to be ready to train your gut, too. It’s all about staying disciplined, sticking to your plan, and not letting fear or greed dictate your next move. The course is your first step, but the real journey is a marathon of continuous learning.

Building Your Learning Path from Beginner to Pro

A person looking at a screen with charts, planning their next move

Think of a good free online stock trading course as your launching pad. It's not the final destination. It’s like the first season of a great TV series-it gets you hooked on the story, but you know there are deeper plot twists to come.

Many platforms that offer free introductory courses also have a clear roadmap to more advanced material. It's a fantastic "try before you buy" approach. You get to dip your toes in the water and see if trading is genuinely for you before committing cash to more in-depth training.

From Free Basics to Pro-Level Skills

Once you’ve nailed the fundamentals, you’ll probably get the itch to level up. This is where you can start looking into structured programs designed to take you from a curious beginner to a certified expert.

Platforms like Coursera have been game-changers, teaming up with world-class institutions to bring top-tier financial education to everyone. After finishing a basic course, for example, you might look into a professional certificate from the New York Institute of Finance (NYIF). Their program packs nine hours of expert-led instruction and hands-on trading simulations, culminating in an exam where you need a 70% score to get certified.

These well-designed programs really work. Studies have shown that learners who follow these kinds of structured paths have 20-30% higher completion rates than people who just piece together random tutorials online.

As basketball legend Michael Jordan once said, "Some people want it to happen, some wish it would happen, others make it happen."

Moving from a free course to advanced training is your way of making it happen. You're taking that initial spark of interest and actively building it into a real, valuable skill.

Adding Advanced Tools to Your Kit

As you make the leap from beginner to pro, it's also time to think about the tools that can give you a serious edge. The financial world moves fast, and staying ahead of the curve often means embracing new technology.

For instance, artificial intelligence isn't just for massive Wall Street firms anymore. You can learn how to leverage AI for financial analysis to uncover deeper insights and make smarter trading decisions. This is the kind of next-level skill that can truly set you apart. Your learning path is an ongoing adventure.

Your Action Plan to Start Learning Today

A person making notes while looking at financial charts on a laptop

Alright, enough thinking, it’s time to take action. Let's get you set up with your first free online stock trading course and turn that curiosity into real knowledge. The goal here isn't to become a Wall Street wizard overnight. It’s about building a solid, consistent learning habit.

Think of it this way: your financial education is the most valuable asset you’ll ever have. And that journey officially kicks off the moment you hit "play" on that first lesson.

Your First Week Learning Plan

To see real progress, you need a simple plan you can actually stick to. Forget about cramming for hours on end-consistency is way more powerful than intensity. Here’s a simple framework to get the ball rolling:

  1. Set Your Study Time: Block out just 30 minutes each day. Seriously, put it in your calendar like it’s an appointment you can’t miss. This small commitment is manageable and helps build momentum.

  2. Take Simple Notes: Don't try to write down every single word. Just focus on jotting down one or two key ideas from each lesson that really stick out. This simple act makes the information stick.

  3. Jump into the Simulator: As soon as the course allows, open up the trading simulator. Don’t be afraid to mess up with fake money-that’s exactly what it’s for! Making those first few practice trades is a massive confidence builder.

The simulator is where the theory becomes real. To find a platform that clicks with you, check out our guide to the best stock market games for traders.

As legendary investor Peter Lynch famously said, "Know what you own, and know why you own it."

This whole idea starts with education. Learning the "why" behind every single trade is the most powerful skill you can build, and this simple action plan is your very first step.

Got Questions About Free Trading Courses? Let's Get Them Answered.

Thinking about diving into a free online stock trading course? It’s totally normal to have a few questions before you start. Let's tackle some of the most common ones.

Can I Really Learn to Trade for Free?

Yes, you absolutely can. The internet is packed with high-quality free courses from trusted financial communities and even top-tier universities. These resources are perfect for learning the essential foundations of trading without spending a dime.

They're designed to give you a solid, risk-free starting point. While you won't become a Wall Street wizard overnight, you'll walk away with the core knowledge to get started with confidence.

Do I Need Any Special Software?

Nope, not at all! If you have a computer or a smartphone and an internet connection, you’re good to go.

Most free courses are completely web-based, so everything-from the video lessons to the trading simulators-runs right in your browser. No complicated downloads or installations required.

How Much Time Does It Take?

That really depends on the course and how deep you want to go. Some are quick, punchy introductions you can finish in just a few hours over a weekend.

"Investing in yourself is the best thing you can do. Anything that improves your own talents; nobody can tax it or take it away from you." – Warren Buffett

Others, like the more comprehensive university-level programs, might require 20-40 hours to complete. The beauty of it is that they're almost always self-paced. You can fit the lessons into your life, whether that means 30 minutes during your lunch break or a few hours on a Sunday afternoon. It’s completely up to you.


Ready to start your learning journey? At Agfin Ltd, our Finance Illustrated Trading School offers a free, bite-sized course that makes learning simple and fun. Build your confidence today.