
Stocks & investing
10 Best Free Investing Tools for Beginners (2026)
10 free investing tools for beginners: calculators, fee checkers, company filings, charts, screeners, trackers and a practice app, with each tool's limits.
A stock chart is a picture of past trades. Learn to read one candle, then volume and trends, and you can describe any chart before you guess what comes next.
A stock chart is a picture of past trades. The line along the bottom shows time. The scale up the side shows price. Each mark sums up the trading in one period, such as one day or five minutes.
Before you look for patterns, check five basics: the company, the exchange, the currency, the dates and the . The interval is the time each mark covers. A 3-month chart with daily candles has one candle for each trading day. A 1-day chart with 5-minute candles cuts one day into small slices. A pattern on one chart can vanish on the other.
The same company can trade in more than one place. A Canadian listing in Canadian dollars is a different chart from a US listing in US dollars.
Most apps offer three chart types:
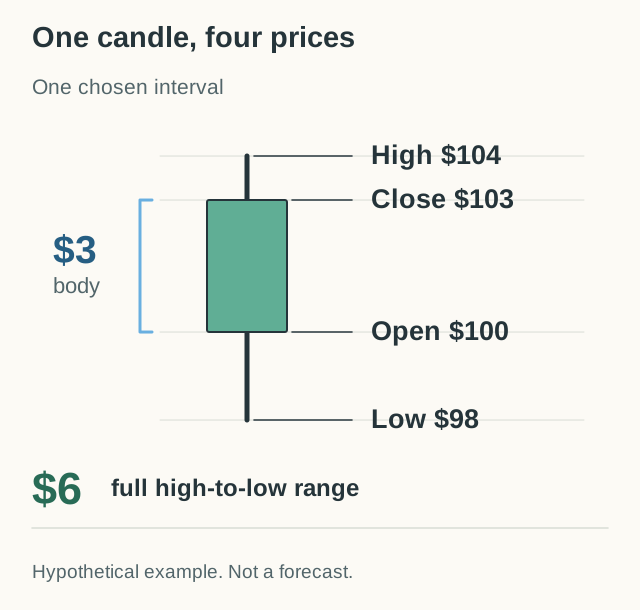
Each candlestick shows four prices for its period. People often call them OHLC:
The thick part is the body. It runs from the open to the close. The thin lines are the . They reach up to the high and down to the low.
Colour tells you one thing only. A green or white candle closed above its own open. A red or black candle closed below its own open. Apps let you change colours, so check the legend.
| Day | Open | High | Low | Close | Volume (shares) |
|---|---|---|---|---|---|
| Monday | $50 | $53 | $49 | $52 | 100,000 |
| Tuesday | $51 | $52 | $48 | $49 | 160,000 |
| Wednesday | $47 | $50 | $46 | $48 | 130,000 |
Notice the gap, too. Tuesday closed at $49, but Wednesday opened at $47. Yesterday's close is not a promise about today's first price.
Try it yourself
Press Play and watch one trading day tick by. See the candle grow from its open price as the day goes on. Then draw a second day and compare the two candles.
Monday in our table opened at $50, rose to $53, fell to $49 and closed at $52. Its body runs from $50 to $52 and is green because the close is above the open. Its wicks reach $53 and $49.
What would you expect?
What this shows: A candle sums up a whole period in four prices. The body joins the open and close. The wicks mark the high and low.
The candle hides the path in between. Two days with very different journeys can draw the same candle, so read the four prices, not just the colour.
is the number of shares traded in a period. It usually shows as bars under the chart. In the table, Tuesday's 160,000 shares mean more trading than Monday's 100,000.
Every trade has a buyer and a seller, so volume is not the number of buyers. High volume means many shares changed hands. It does not tell you who was right, how long they will hold or where the price goes next.
Traders often note whether a big move came with heavy or light trading. That is useful context, but it is not a signal on its own. Company news, results and changes to an index can all lift volume for a day. Compare days of the same length, because a half-day session or extra trading hours change the count. Our guide to stock market opening hours explains sessions and holidays.
A is the general direction of the price. In an uptrend, each high and each low is higher than the one before, like steps going up. In a downtrend, each high and low is lower. When the price moves inside a band with no clear steps, people call it sideways.
Many traders also mark , an area where falls stopped before, and , an area where rises stopped before. These marks help you ask questions. They are not real floors or ceilings. A price can break through them, jump past them on news, or cross them for a moment and turn back.
If you draw a line, write down your rule. Which chart and interval? What counts as a break? What would show your idea was wrong? A line that you redraw after every move cannot be tested.
A turns recent prices into one smooth line. A simple 3-day average adds the last 3 closes and divides by 3. From the table: ($52 + $49 + $48) ÷ 3 = $49.67. The next day, the oldest close drops out and the newest one comes in.
Charts often show 20-day, 50-day or 200-day averages. Because the line is built from past prices, it always reacts late. A price crossing its average is something that happened, not proof of what comes next.
Some traders read a price above its average as a sign of an uptrend, and a price below it as a downtrend. That describes what already happened. It does not tell you what comes next.
Change the number of days and the crossing can move too. So choose your rule first, before you look for the answer you hope to see.
The price scale changes what you see. Say a stock rises from $10 to $20, then from $20 to $30. Both moves add $10. But the first is a 100% gain and the second is a 50% gain.
On a normal scale, the two moves look the same size. On a , equal percentage moves look the same size, so the second move looks smaller. A tightly cropped price axis can also make a small move look huge. Read the numbers on the axis, not just the shape.
Two charts of one stock can still differ. One may adjust old prices for stock splits or dividends, and another may not. One may include trades outside normal market hours. Some prices are delayed. If a jump looks strange, check the data source and the company news before you build a story around it. A stock split, for example, can explain it. A split changes the share price but not the company's total value, as our market capitalization lesson shows.
Describe first, guess later. Try two sums with the table:
Wednesday's green candle hides a bigger fall. Over the three days, the price fell about 7.7%.
Then use the same short routine on any real chart:
Next lesson: what paper trading is, so you can practise reading charts with virtual money. To learn the common candle shapes, read how to read candlesticks, or see how traders test chart rules in technical analysis basics. To practise on live charts with virtual money, see our stock market simulators guide.
A common starting point is a one-year chart with daily candles. It shows enough history to see the main trend without too much day-to-day noise. Then zoom in and out, and notice how the picture changes.
No. A chart shows past trades. It can help you ask better questions, but news, company results and the wider market can move a price in ways no chart shows. Treat every reading as an idea to test, not a forecast.
Apps use different colour settings. Green or hollow usually means the close was above the open. Red, black or filled usually means it was below. Check the legend in your app before you read the colours.
A line chart joins the closing prices. A candlestick chart shows the open, high, low and close for each period, so you can see how far the price moved inside each day.
10 free investing tools for beginners: calculators, fee checkers, company filings, charts, screeners, trackers and a practice app, with each tool's limits.
10 well-known dividend stocks, from Coca-Cola to Main Street Capital: their dividend records, risks and how to check them. A research list, not buy tips.