Think of a beginner forex trading course as your personal cheat code for the financial markets-it’s where you learn the rules of the game before you put any real money on the line. These courses are designed to build your skills and confidence, taking you from a curious spectator to a prepared trader.
Why A Forex Course Is Your Smartest First Move
Ever feel like the world of finance is some exclusive club you weren't invited to? Let's fix that.
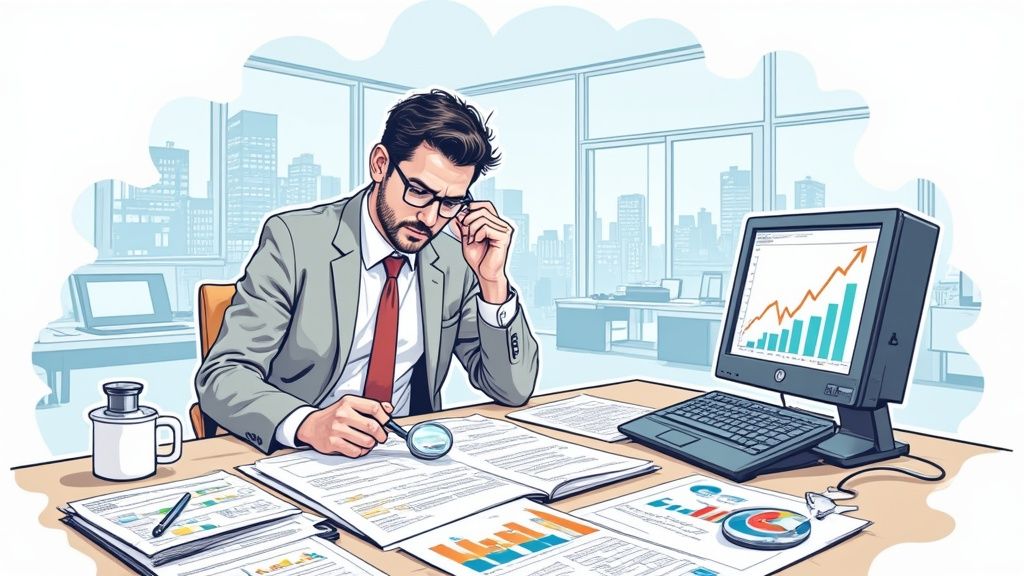
Jumping into forex trading without any training is like trying to beat a video game on the hardest difficulty without ever playing the tutorial. It's a quick way to lose. A structured course is your map and your strategy guide, all rolled into one, giving you a solid footing from day one.
Look at legendary investors like George Soros. He's known as "The Man Who Broke the Bank of England" after he famously made a billion dollars in a single day betting against the British pound in 1992. His incredible success wasn't built on luck; it came from a deep understanding of market rules and human psychology. He famously said, "The financial markets generally are unpredictable… The idea that you can actually predict what's going to happen contradicts my way of looking at the market."
This gets right to the heart of it: you need a strategy, not a crystal ball. That's the exact mindset a good course helps you build.
Building Skills, Not Just Knowledge
A quality beginner forex course does more than just dump a textbook's worth of facts on you. It’s all about building practical, real-world skills. You're not just memorizing terms; you're learning how to think like a trader.
Here's a quick look at the essential skills you'll gain from a foundational forex trading course.
What a Beginner Forex Course Actually Teaches You
| Skill Category | What You Learn | Why It Matters for You |
|---|---|---|
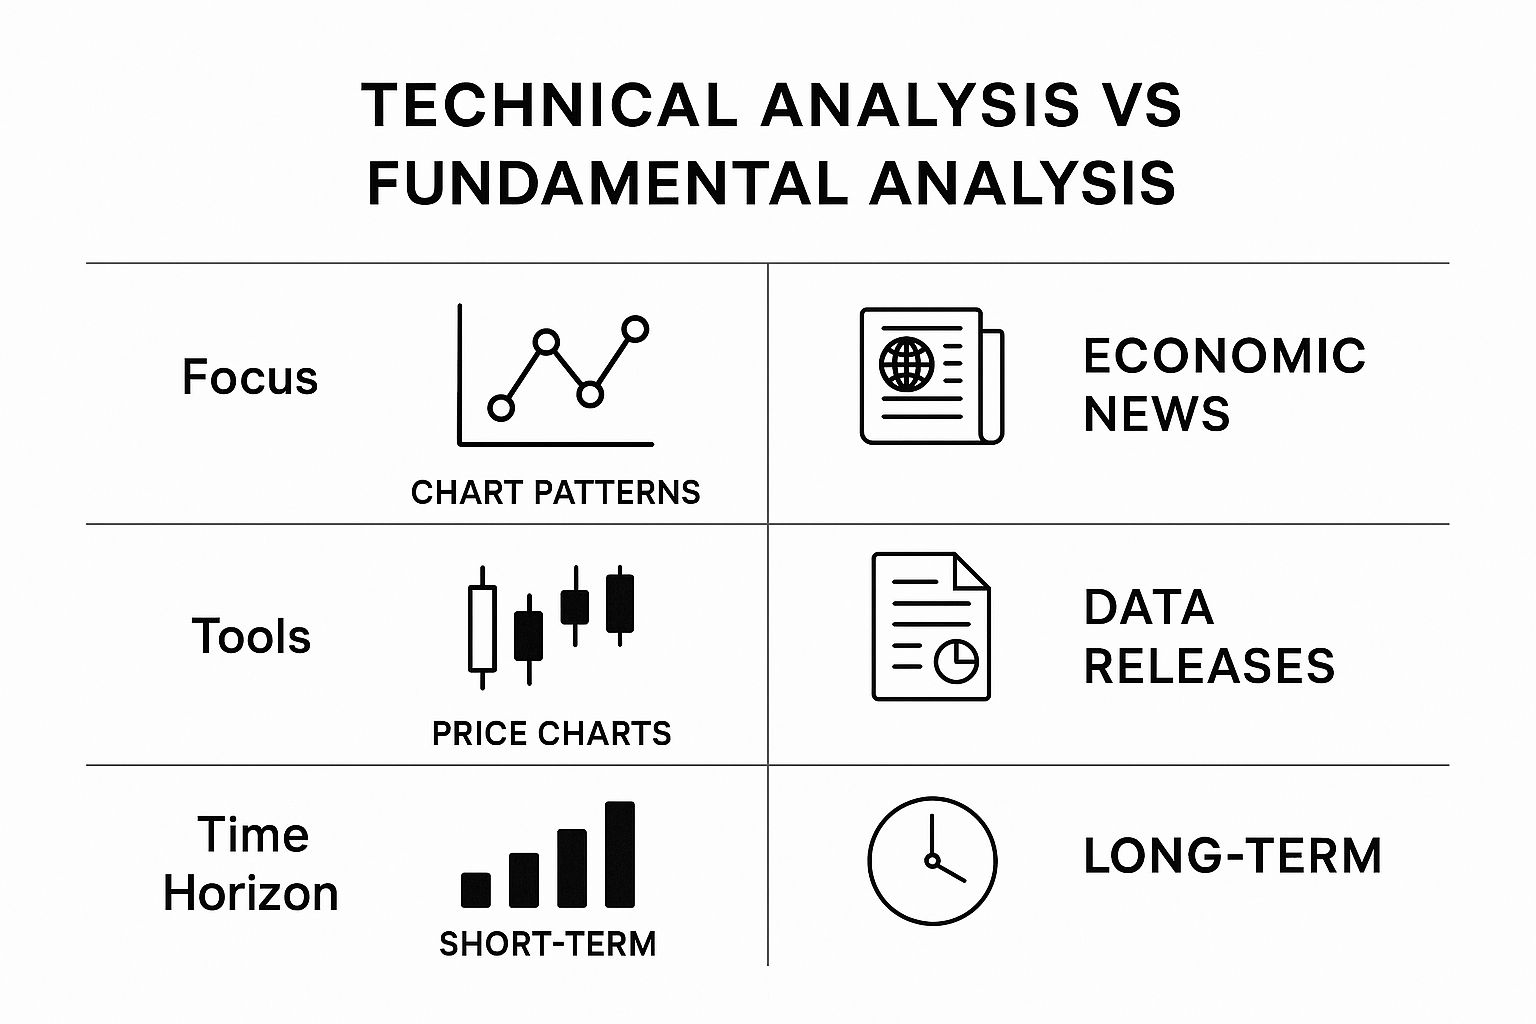
| Market Fundamentals | The "why" behind price movements-economic news, interest rates, global events. | You'll stop seeing charts as random squiggles and start understanding the stories they tell. |
| Risk Management | How to protect your starting capital with stop-losses and proper position sizing. | This is your financial seatbelt. It's the #1 skill that separates successful traders from gamblers. |
| Trading Psychology | How to control fear and greed, stick to your plan, and make disciplined decisions. | Your own emotions can be your biggest enemy. This helps you stay in control when real money is on the line. |
| Technical Analysis | How to read charts, identify trends, and use indicators to find potential entry/exit points. | This is your toolkit for making informed predictions about where the market might go next. |
| Strategy Development | How to build a personalized trading plan that fits your goals and risk tolerance. | A trading plan is your personal rulebook. It keeps you from making impulsive, emotional mistakes. |
This systematic approach is why so many traders invest in their education first. In fact, with over half of traders buying educational materials each year, it's clear that structured learning is seen as a vital part of building a sustainable trading career.
Modern courses have come a long way from dry PDFs. To see just how powerful new learning methods can be, it's worth understanding the benefits of interactive video for corporate training, which are now being used to make complex trading topics much easier to absorb.
Instead of making expensive mistakes with your own money, a course gives you a safe space to learn from the wins and losses of others. It helps you manage your expectations and sets you on a path to becoming a disciplined, informed trader.
Learning the Language of Forex Trading
Before you can even think about trading, you need to learn how to speak the language. The forex market is like a massive global conversation that runs 24/5, and a good beginner forex trading course acts as your personal translator, cutting through all the confusing terms.
This conversation is built on a handful of core concepts. Without them, you're essentially flying blind. Our mission is to demystify the jargon so you can glance at a trading platform and actually understand what’s happening.
"An investment in knowledge pays the best interest." – Benjamin Franklin
Nowhere is this truer than in trading. Getting a handle on the vocabulary is your first real investment, and it’s the one that safeguards every other dollar you’ll put on the line later.
Your First Forex Words
Let's start with the absolute essentials. Think of these as the foundational building blocks you can't trade without.
-
Currency Pairs: Currencies are always traded against each other, like EUR/USD. The easiest way to think about it is like a tug-of-war between two economies (in this case, the Eurozone and the United States). You’re essentially placing a bet on which side will pull harder. If you want to really nail this down, our guide on how to read currency pairs is the perfect next step.
-
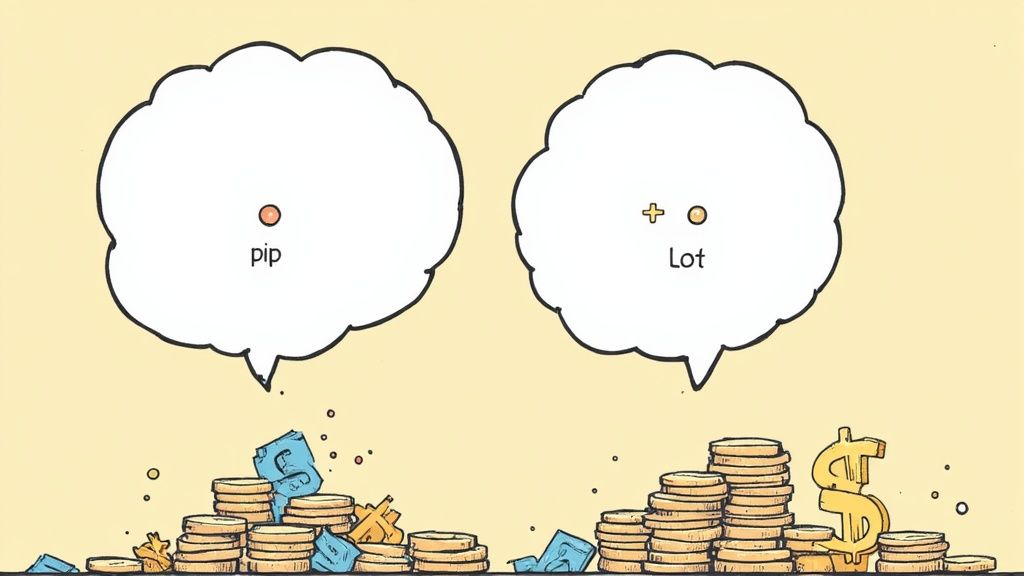
Pip: A 'Pip' is short for 'Percentage in Point.' It's the smallest possible price move a currency pair can make. Think of it as a single point in a basketball game-one point might not seem like much, but they add up fast and ultimately decide who wins or loses the trade.
-
Leverage: This is a powerful tool, kind of like using a car jack to lift a two-ton vehicle with minimal effort. In trading, leverage lets you control a large position with a relatively small amount of your own money. It’s fantastic for amplifying profits, but it's a double-edged sword that will just as easily amplify your losses if a trade goes against you.
-
Lot Size: This term simply refers to how big your trade is. A standard lot is 100,000 units of currency, but don’t let that number scare you. Brokers offer mini and micro lots, which are perfect for beginners who are starting out with a smaller account.
To really get the most out of your learning, it helps to understand your own personal strengths. Digging into the different learning styles in adults can make the whole process click much faster. By the time you wrap up a solid introductory course, you'll have the vocabulary you need to follow market news and place your first trades with confidence.
Choosing Your Tools of the Trade
Every craftsman needs their tools, and traders are no different. Before you even dream of placing that first trade, you've got to get your hands dirty with your main piece of kit: the trading platform. This is your command center, your digital cockpit where all the magic happens.
Think of it like the dashboard of a race car. It shows you the track ahead (the charts), lets you monitor your speed, and gives you the controls to accelerate, brake, and steer. For traders, this is where you’ll size up the market and put your money to work.
Any beginner forex trading course worth its salt will spend a good chunk of time making sure you master this. It’s the arena where you'll be competing, and knowing it like the back of your hand is simply non-negotiable.
Your First Trading Platform
For most folks just starting out, one name pops up over and over again: MetaTrader 4, or MT4. You can think of it as the Swiss Army knife for traders-it’s the industry standard, loaded with powerful features, yet it's surprisingly easy to get the hang of once you learn the ropes.
It’s so popular that a staggering 85% of forex traders rely on the MT4 platform. That massive user base is a huge plus, meaning there's a giant community and endless tutorials out there to help you find your footing. To get a better sense of how traders use these tools, it's worth checking out some current forex trading statistics.
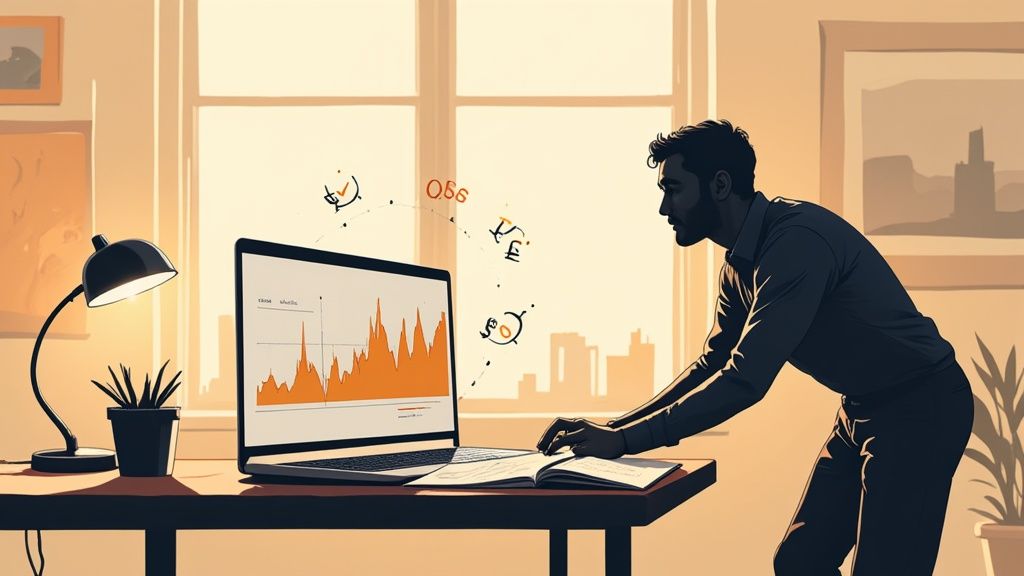
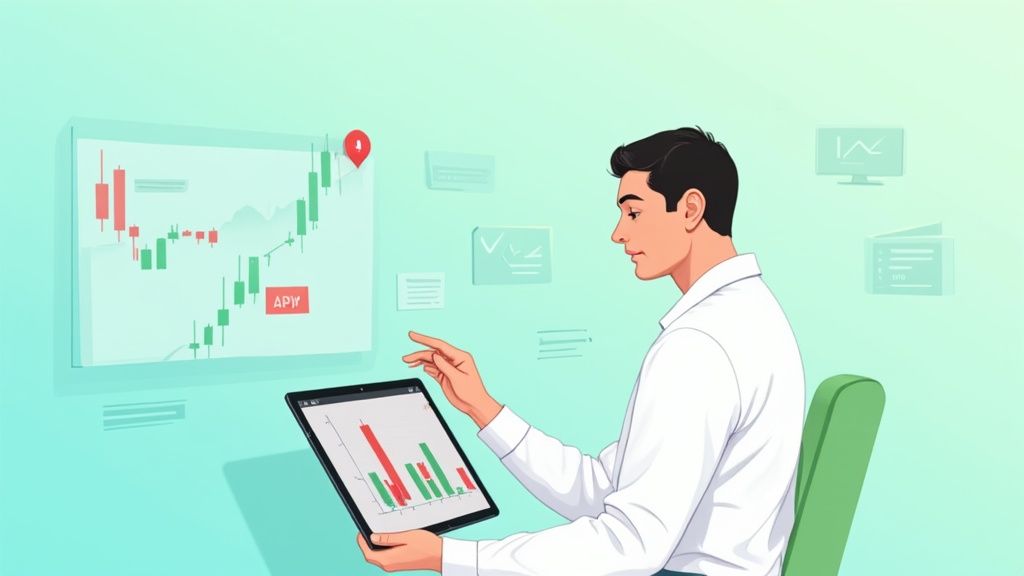
Learning to Read the Story in the Charts
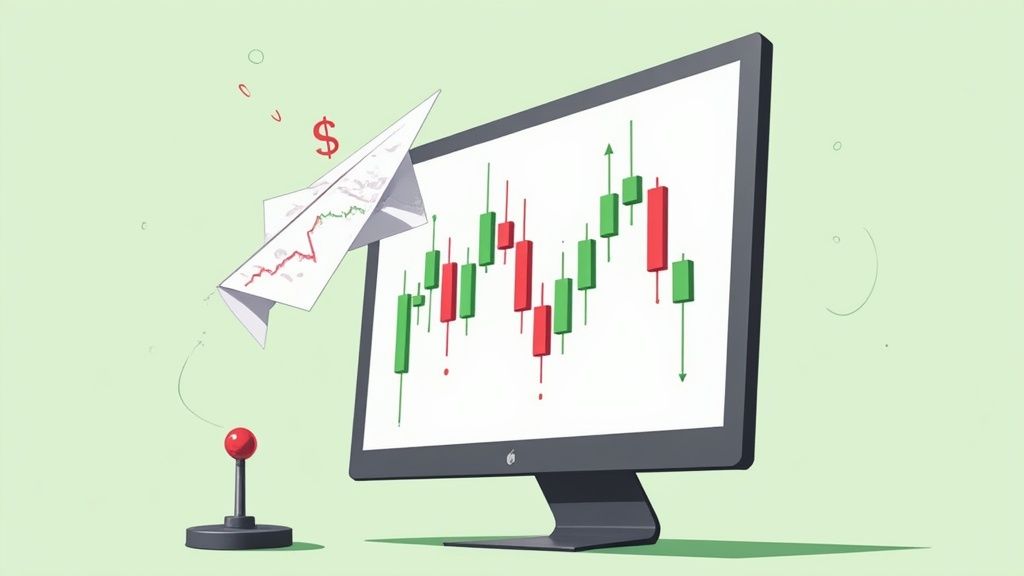
Once you’ve got your platform set up, the next big hurdle is learning to read charts. At first glance, they might just look like a chaotic scribble of lines from a heart monitor, but they’re actually telling a powerful story-a visual tug-of-war between buyers and sellers.
Your job is to become a storyteller, to learn how to interpret that narrative. Most successful traders, especially when they’re new, find that simplicity is their best friend. They stick to daily charts. Looking at the market one day at a time helps filter out all the distracting short-term “noise” and gives you a much clearer, big-picture view of where things are actually headed.
"The goal of a successful trader is to make the best trades. Money is secondary." – Alexander Elder
This quote nails the mindset you need. Focus on learning your tools and reading the charts properly first. The profits will follow. By getting comfortable with your platform and learning to read the market's story on a daily chart, you’re laying the solid foundation you need to trade smarter and with more confidence.
The Most Important Lesson: Protecting Your Capital
This is the chapter that separates traders from gamblers. If there's one single lesson in any beginner forex trading course that matters more than all the others, it's this one: learn how to protect your money. It’s not about hitting that one-in-a-million trade; it's about staying in the game long enough to build consistent wins.
Legendary investor Warren Buffett summed it up perfectly with his two famous rules.
"Rule No. 1: Never lose money. Rule No. 2: Never forget rule No. 1."
What he’s really saying is that your number one job is to play defense. One massive loss can completely erase a dozen smaller wins and kick you out of the market for good. To make sure that doesn't happen, you have to learn how to manage risk like a professional.
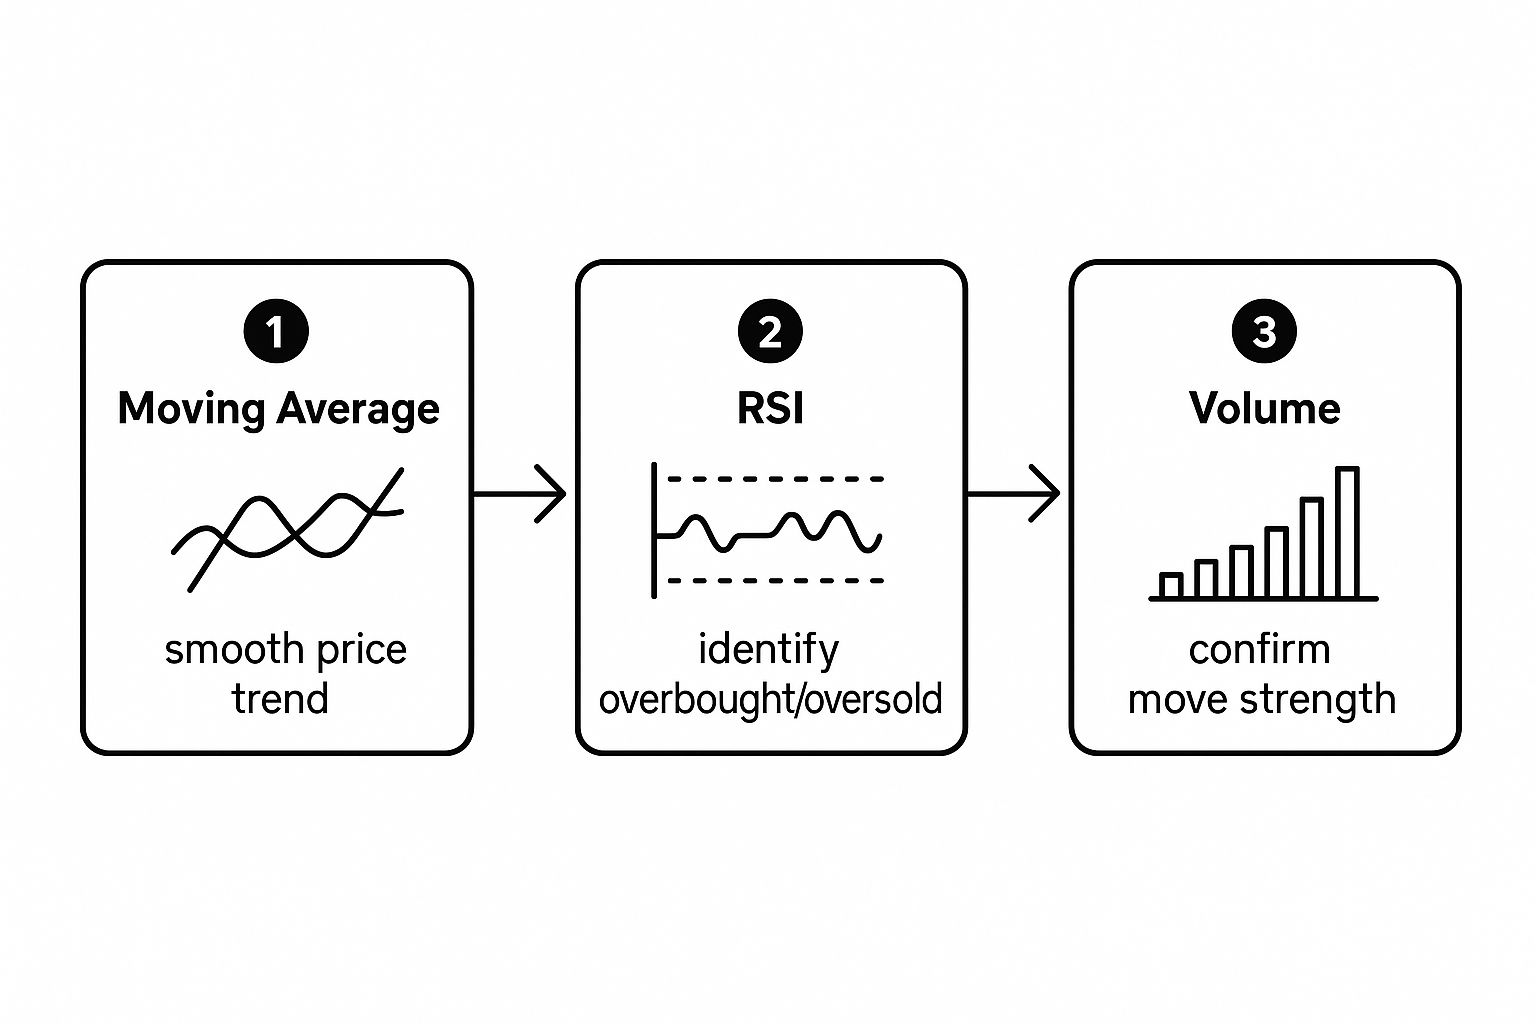
This infographic breaks down the essential tools you'll be using to control your trades and keep your capital safe.
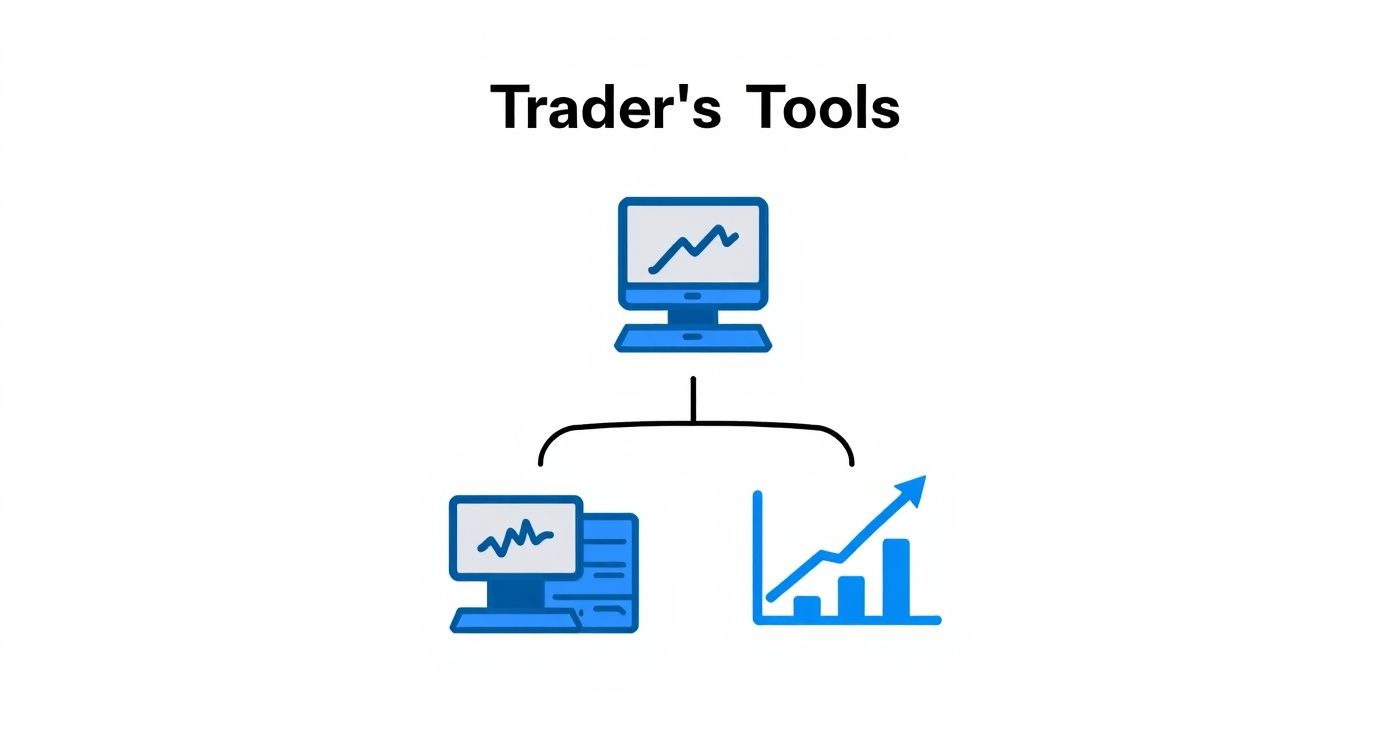
As you can see, everything starts with your trading platform. From there, you use your charts and analysis to make decisions, but it's the risk management tools that truly keep you in control.
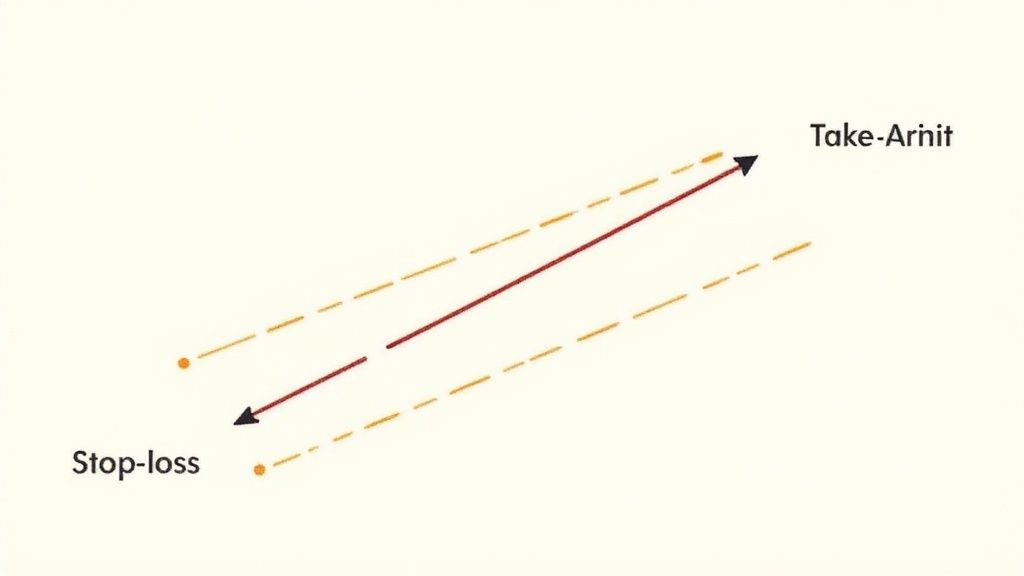
Your Financial Escape Hatch
Your best defensive move in trading is the Stop-Loss. Think of it as a pre-set eject button for your trade. It's an order you place with your broker that basically says, "If this trade starts losing a certain amount of money, get me out immediately." No questions asked.
This is your safety net. It’s what prevents a small, acceptable loss from spiraling into a catastrophic one that blows up your account. For professional traders, setting a stop-loss on every single trade isn't optional-it's a non-negotiable rule that ensures they live to trade another day.
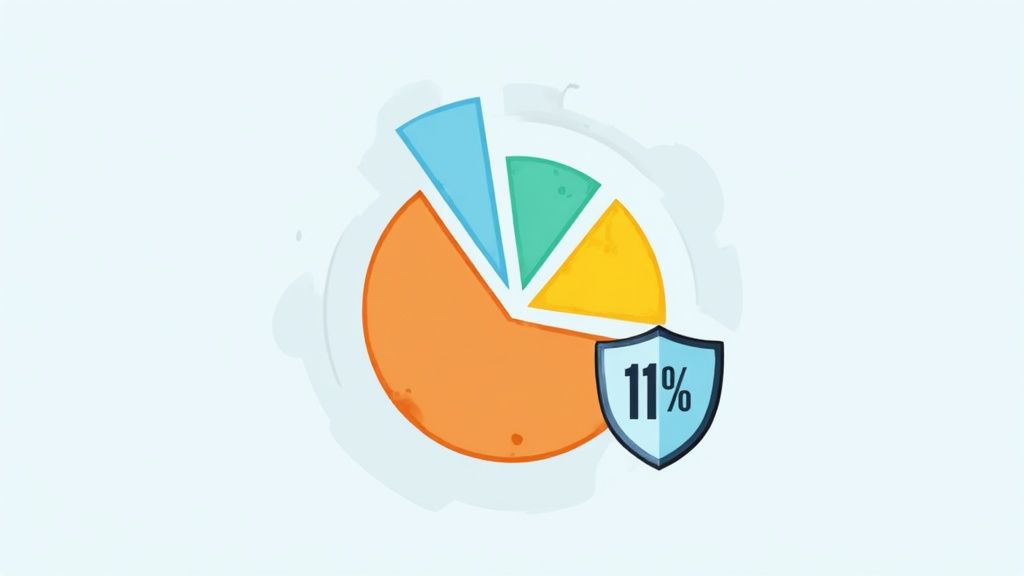
Another dead-simple but incredibly powerful defensive strategy is the 1% Rule. It’s a personal guideline where you promise yourself you will never risk more than 1% of your total trading capital on any single trade.
- If you have a $1,000 account, your maximum risk per trade is $10.
- If you have a $500 account, your maximum risk per trade is just $5.
Before placing any real trades, it's crucial to get comfortable with a few fundamental risk-control methods.
Simple Risk Management Techniques
| Technique | How It Works for You | Simple Analogy |
|---|---|---|
| Stop-Loss Order | Automatically closes a trade at a pre-set price to cap your losses. | It's like setting a fire alarm. If things get too hot, it goes off and gets you out before the whole house burns down. |
| The 1% Rule | Never risk more than 1% of your account on a single trade. | Think of it as betting rules at a casino. You only bet a tiny fraction of your chips at once so one bad hand doesn't wipe you out. |
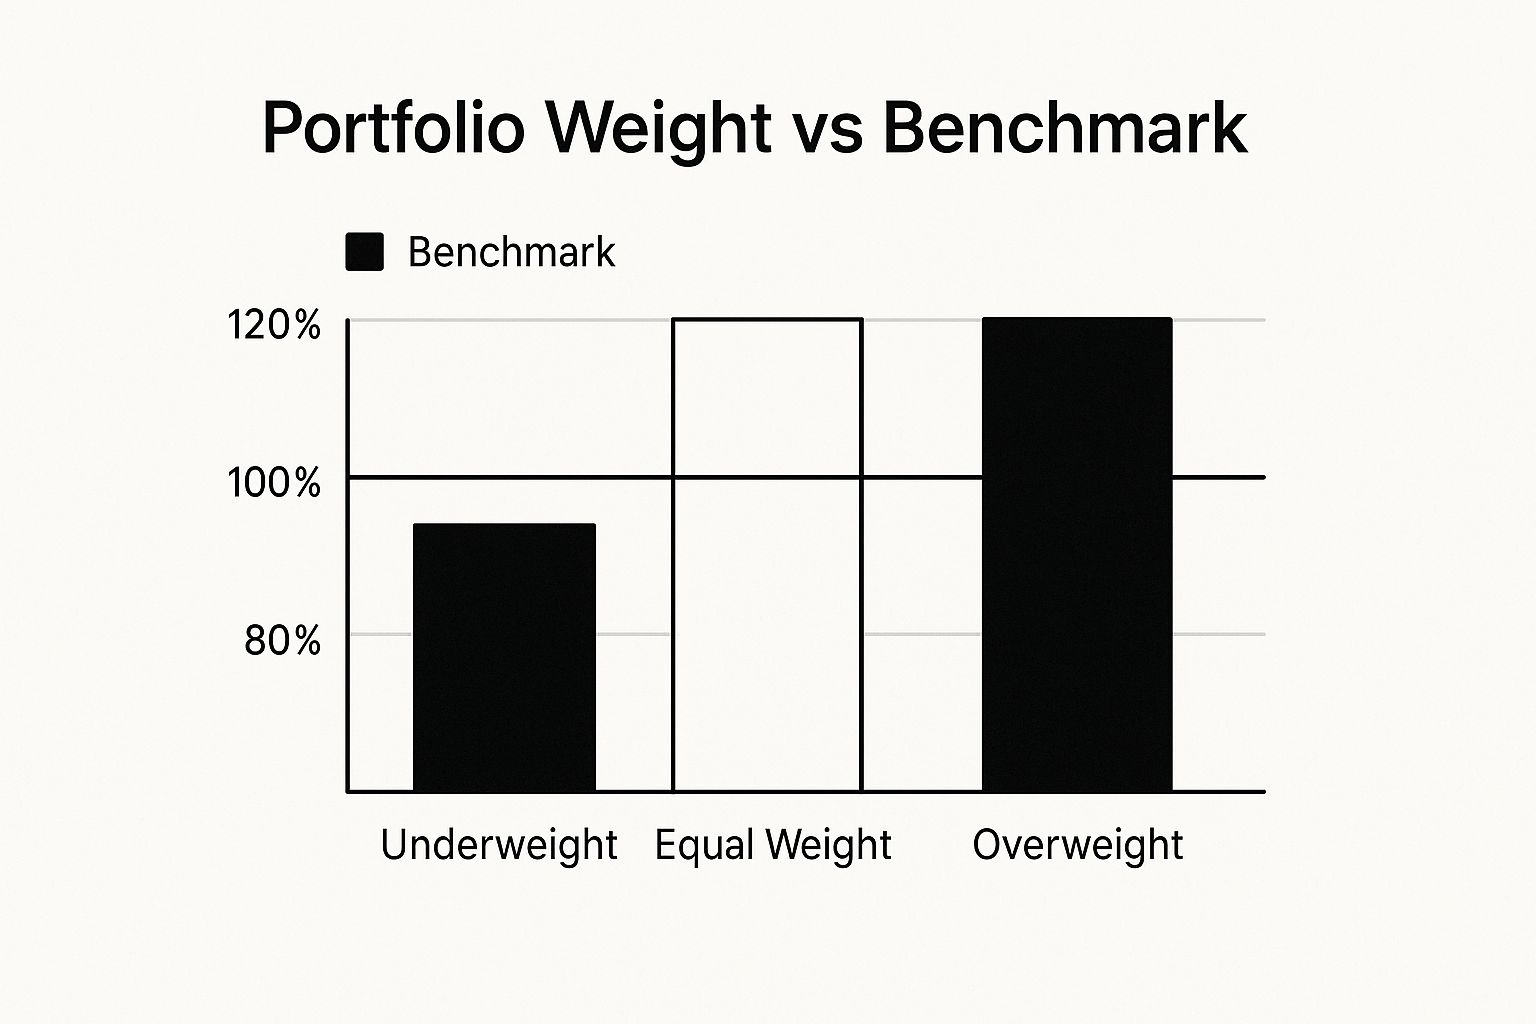
| Position Sizing | Adjusting your trade size based on your stop-loss distance and the 1% rule. | It’s like pouring a drink. You pour less into a small glass and more into a big one to avoid spilling over. |
Sticking to these rules makes it almost mathematically impossible to lose your entire account quickly. It forces you to be disciplined, make smarter decisions, and survive the losing streaks that every single trader-even the best in the world-goes through.
Winning in trading is a marathon, not a sprint. These defensive rules are how you build the endurance to cross the finish line.
Putting Your Knowledge into Practice
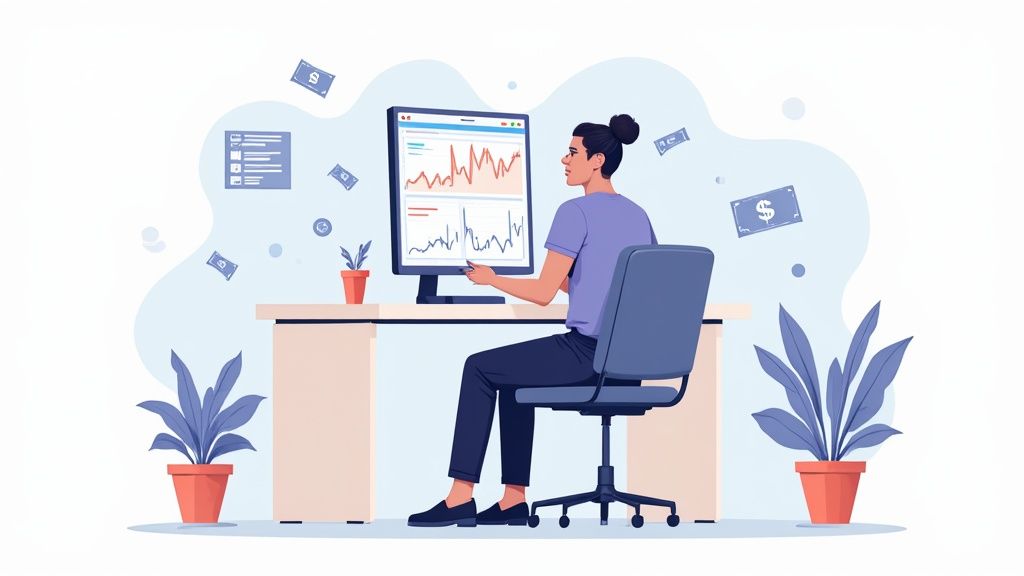
Theory is great, but the real learning happens when you roll up your sleeves and get your hands dirty. It’s time to gain some practical experience without putting a single dollar of your own money on the line. This is where the beginner forex trading course introduces its most powerful tool: the "demo account."
Think of a demo account as a trading simulator. It's the flight simulator for a pilot, the driving range for a golfer. It’s your own personal sandbox where you can test-drive everything you've learned in a completely safe space. This is where you’ll click the button on your first trade, set a stop-loss, and watch how the market actually behaves.
Even celebrities who get into trading, like Michelle Williams, started right here at the beginning. She reportedly won a world championship trading competition-turning $10,000 into $100,000 in under a year-after taking a course and learning the fundamentals, proving that practice always comes before profit.
Your First Practice Trades
The goal here isn't to become a paper millionaire overnight. It's about building confidence and, more importantly, developing good habits from the very start. The experience you gain is far more valuable than any fake profit you rack up. Before diving in, you might also want to learn how to backtest trading strategies, which is an awesome way to test your ideas against historical market data.
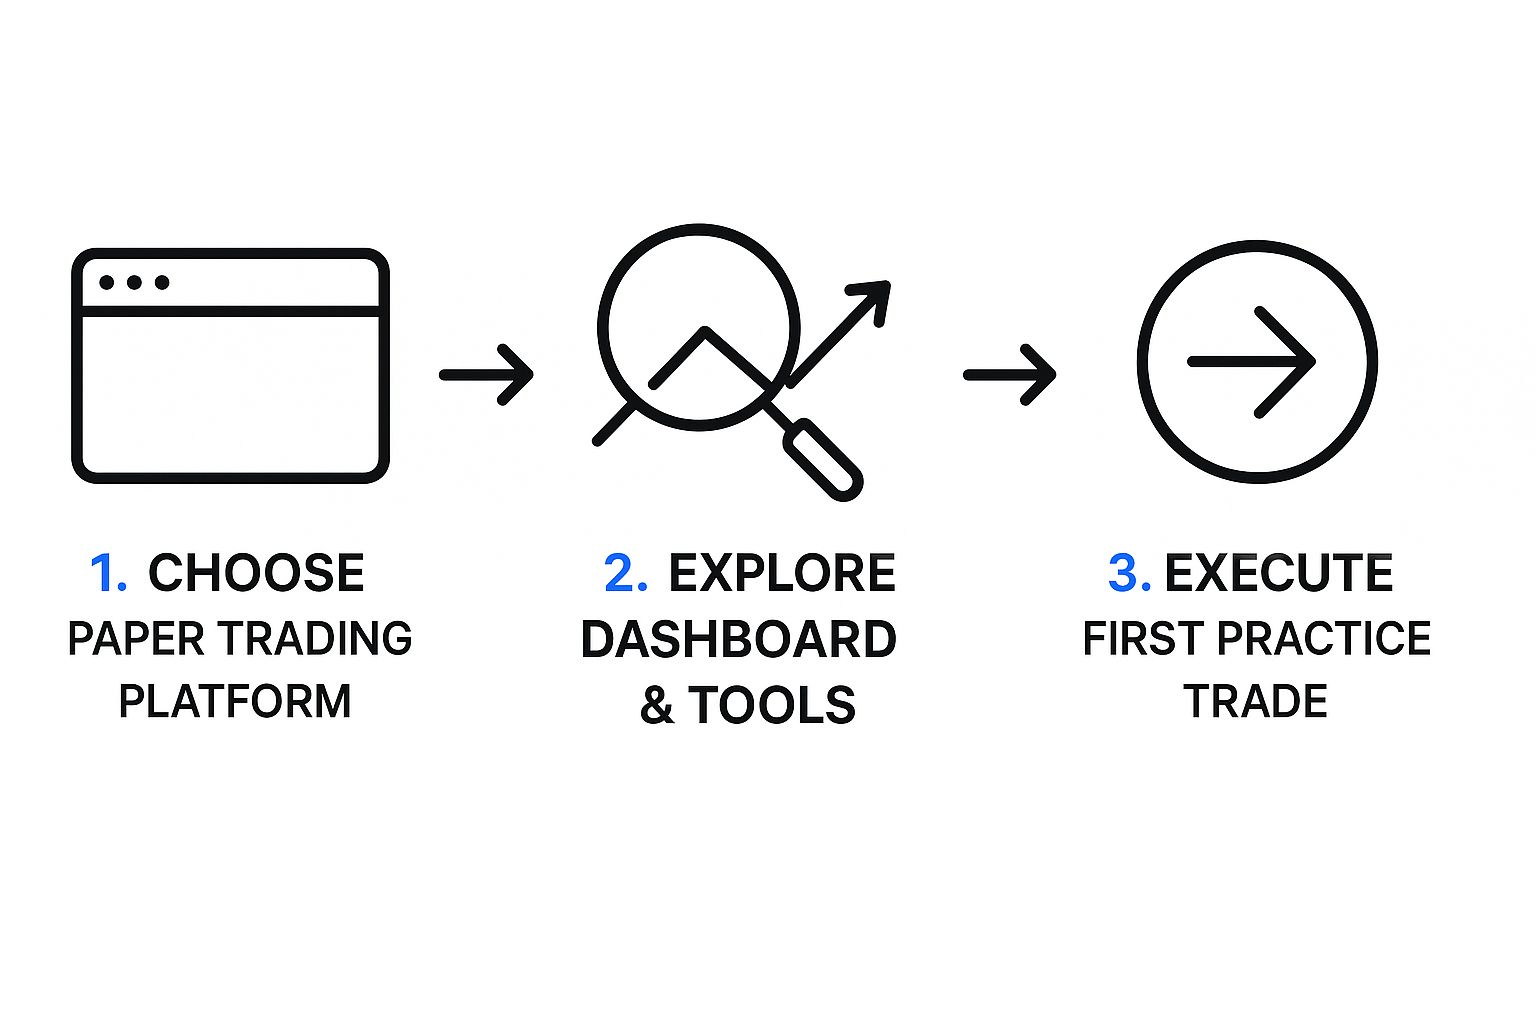
Here’s a simple game plan for your first few sessions in the simulator:
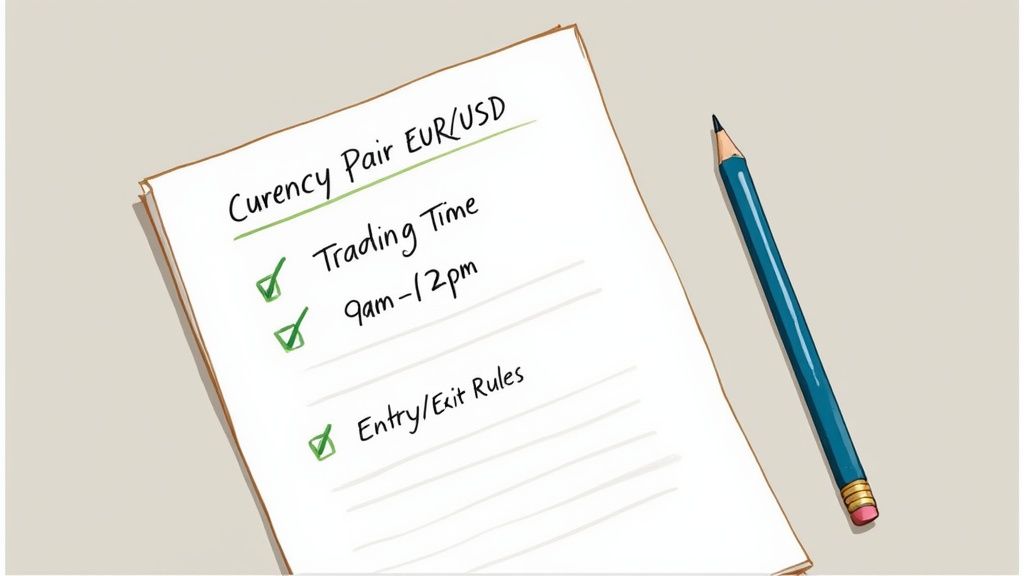
- Pick a Major Pair: Keep it simple. Start with a heavyweight pair like EUR/USD or USD/JPY. They tend to be more predictable and are easier to follow for beginners.
- Place a Small Trade: Just get a feel for the mechanics of opening a position. Don't overthink it.
- Set a Stop-Loss: This one is non-negotiable. Practice protecting your capital on every single trade, right from day one. Make it muscle memory.
- Watch and Learn: Now, just observe. See how the price reacts to news events or economic data releases. Get a feel for the rhythm of the market.
This risk-free practice is the essential bridge between knowing the theory and actually trading. It’s fun, it’s educational, and it's an absolute must for any new trader.
Your Questions Answered
Got a few questions rattling around in your head? Good. That’s a sign you're taking this seriously. It's totally normal to be curious-or even a little skeptical-before jumping into something new like a beginner forex course.
Let's cut through the noise and tackle the big questions head-on. My goal is to give you straight answers so you can move forward with confidence.
Is It Too Late to Start Forex Trading?
Not a chance. It might feel like everyone else got a head start, but new traders are jumping into the market every single day. And it’s not just for the young, tech-savvy crowd, either.
You might be surprised to learn that a huge chunk of traders are more mature. In 2025, there are about 1.3 million forex traders in the US alone, and a massive 58% of them are over the age of 40. People from every walk of life are starting their trading journey right now. You can dive deeper into the US forex trading demographics here.
Do I Need a Lot of Money to Start?
This is one of the biggest myths holding people back. You absolutely do not need a massive bankroll to get your feet wet, thanks to things like leverage and micro accounts. Many brokers will let you open an account with $100 or even less.
What a good course really drills into you is how to manage that small account effectively. The focus isn't on the size of your starting capital, but on how smart you are with protecting and growing it.
"The secret to being successful from a trading perspective is to have an indefatigable and an undying and unquenchable thirst for information and knowledge." – Paul Tudor Jones
That quote from a trading legend says it all. Your most valuable asset isn't your money; it's your drive to learn how to do this the right way.
How Long Does It Take to Learn?
There’s no magic number here-everyone picks things up at their own speed. But a solid introductory course can get you comfortable with the absolute essentials in just a few weeks of focused effort.
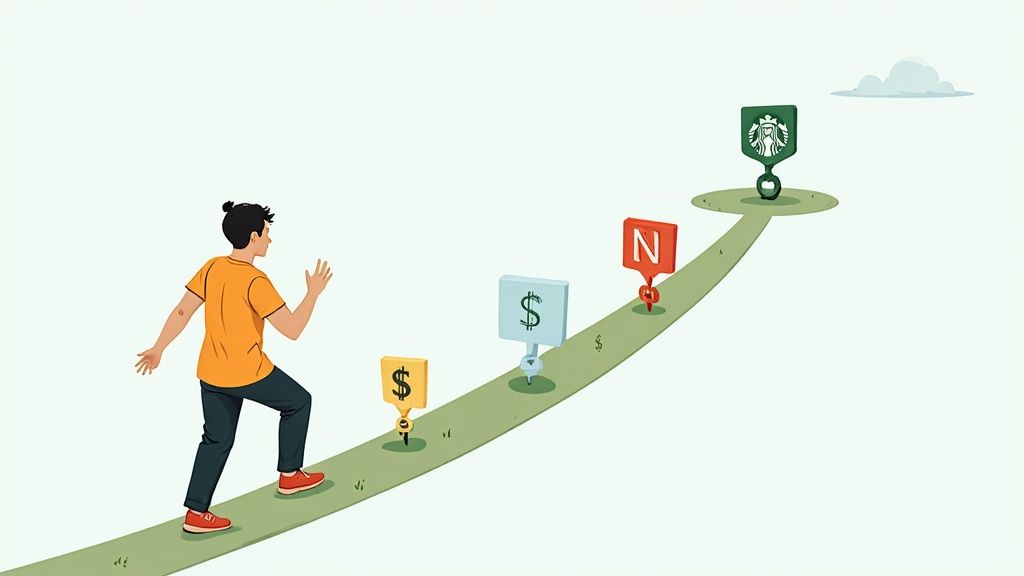
A realistic timeline might look something like this:
- Weeks 1-2: Getting a grip on the core lingo and basic concepts.
- Months 1-2: Practicing what you've learned on a demo account without risking a dime.
- Months 3-6: Feeling ready to trade with very small amounts of real money.
Becoming a consistently profitable trader is a marathon, not a sprint. The first step is just committing to learn the fundamentals, and a well-built course is your shortcut to getting there.
Ready to stop wondering and start doing? The free Trading School at financeillustrated.com will walk you through the basics of forex in about an hour. Jump in and start building real confidence today at https://financeillustrated.com.