
Forex
15 Forex Strategies and Patterns for Beginners (and How They Fail)
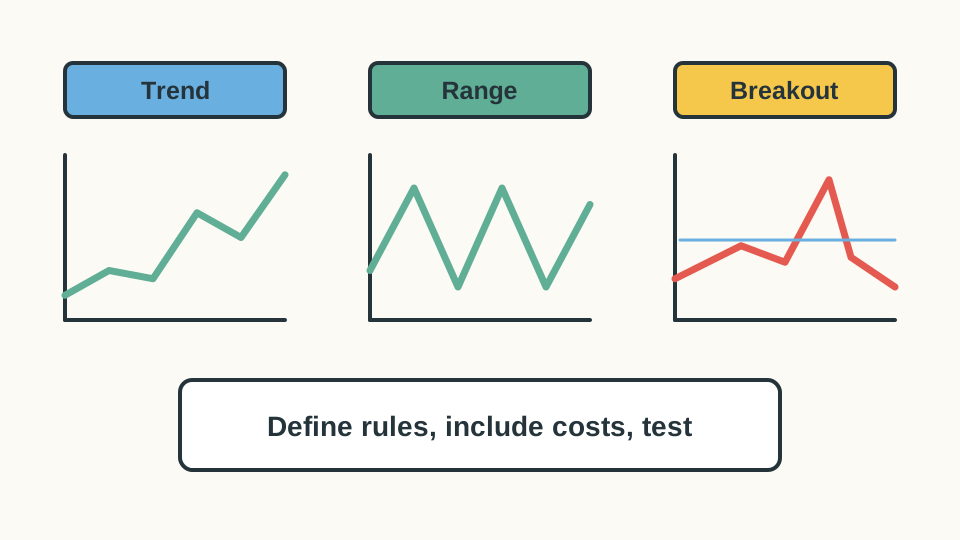
15 forex strategy ideas and chart patterns, from head and shoulders to carry trades: what each one bets on, how it fails and how to test one honestly.
Before a trade, you can plan how much you might lose and how much you hope to gain. Learn to compare the two, and what the ratio cannot tell you.

Before you buy, you can plan two exits. A is the price where you plan to sell if the trade goes wrong. A is the price where you plan to take your profit. The compares the two distances: risk (entry minus stop) to reward (target minus entry). Risk 20 to make 40 and the ratio is 1:2.
For a trade where you buy first, called a , the maths is simple:
On this page, 1:2 means you risk 1 to try to make 2. Some people write the reward first, or just say "2". Always say which way round you mean. New to pips? Read how much a pip is worth first.
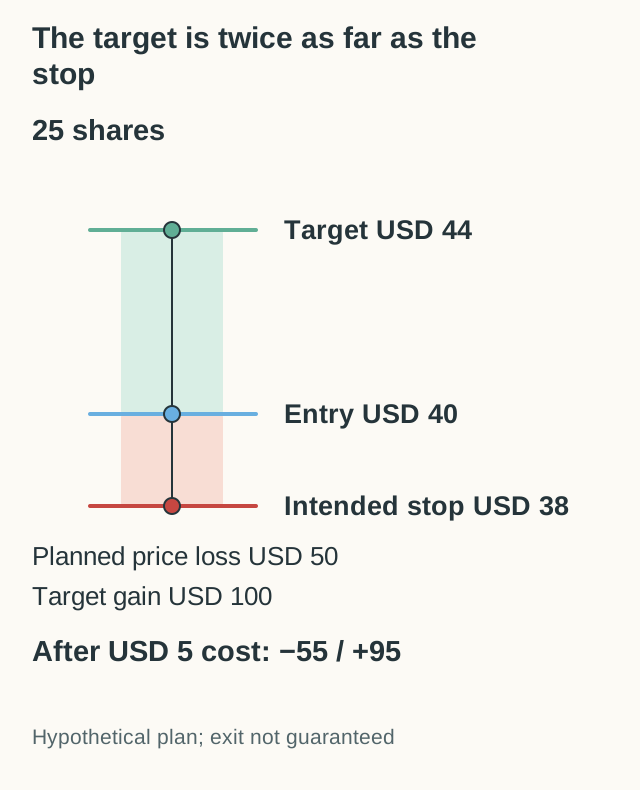
The ratio tells you how often you must win just to break even. The formula is risk ÷ (risk + reward). For our trade, that is 20 ÷ (20 + 40) = 33.3%. So you need to win 1 trade in 3, before costs.
Costs change this. Say the spread and fees cost $2 per trade in total, win or lose. Your loss becomes $22 and your gain becomes $38. Now the is 22 ÷ (22 + 38) = 36.7%.
Here is what that means per trade, on average, using those numbers after costs:
These win rates are inputs for practice, not your real odds. A few practice wins tell you very little about your true win rate.
Try it yourself
Drag the stop and target lines, or use the sliders. Watch the risk, the reward and the break-even win rate change. Then press Play the market.
Entry 1.1000, stop 1.0980, target 1.1040, 10,000 euros: you risk $20 to make $40. Break-even win rate: 20 ÷ (20 + 40) = 33%. Move the target to 1.1060 and it falls to 25%, but 1.1060 is further away.
What would you expect?
What this shows: At 1:2 you break even by winning 1 trade in 3. Move the target further away and that drops, but reaching it gets harder.
The ratio sets how often you must win, not how often you will. On a random price path, a target further away is reached less often, so the ratio alone never makes a trade good.
A bigger target lowers the win rate you need. But a target that is far away is also reached less often. The ratio alone cannot tell you which effect is stronger.
Take 10 made-up trades, each with a $10 planned loss and a $30 target, before costs:
Same ratio, different result. Now add a $1 cost to every trade, so $10 for all 10. The first result falls to $10, and the second becomes a $30 loss.
So do not just ask whether 1:3 is good. Ask what has to happen for the price to reach your target, and what evidence you have for it. A distant target can make a plan look great on paper without making it more likely.
No. A stop is a plan, not a promise. When the price reaches your stop, a normal stop order becomes a market order and closes at the next price available. If the price jumps past your stop, the exit can happen lower. A stop-limit order may not close the trade at all. FINRA explains how these order types work in its guide to order types; forex and CFD platforms use the same names.
In our example, you planned to sell at 1.0980 and lose $20. If the first price available is 1.0970, you lose $30 instead. The $20 was a planning number, not a limit the market has to respect. Big news and weekend gaps are when this happens most.
That is why it helps to write three separate lines in your practice journal: the planned loss, the estimated costs and the actual result. Do not rewrite the plan after you see the outcome.
The ratio does not tell you how much money to put in. That is a separate choice, called .
One common method starts from a loss budget: the most you are willing to lose on one trade. CME Group's lesson on the 2% rule explains this idea. It also says the exact percentage in its example is a choice, not a law.
Work backwards from the budget. With a $20 loss budget and a 20-pip stop, each pip may cost you at most $1. On EUR/USD, $1 a pip means 10,000 euros. With a 40-pip stop and the same $20 budget, you could only trade 5,000 euros. If costs also come out of the budget, the trade must be smaller still.
Also check your total exposure. Two trades that depend on the same thing, such as buying EUR/USD and GBP/USD, can lose at the same time. Our daily trading habits lesson walks through a full sizing example.
Put them where the chart gives you a reason, not where the ratio looks nice. Many traders place a stop just beyond a price that would show the idea is wrong, such as below a recent low or a support zone. A target is often placed just before a level where rises stopped in the past.
Some traders use a fixed distance instead, such as 20 pips below the entry. That keeps things simple, but it ignores how much the pair usually moves. A calm pair and a jumpy one may need different stops.
Watch out for three common mistakes:
Write the plan down before you trade, and compare it with what happened afterwards. Next lesson: forex market hours, so you know when big moves and wide spreads are most likely.
There is no single good number. With 1:2 or 1:3 you can win less often and still break even, but only if your targets are reached often enough. Always judge a ratio together with your real win rate and your costs.
Flip the formula. In a short trade you sell first and hope to buy back lower. Risk is the stop price minus the entry price, and reward is the entry price minus the target price. The pip and money sums work the same way.
Both are used. On this page, 1:2 means you risk 1 to try to make 2. Some traders put the reward first, or write it as one number, like 2. Always say which way round you mean.
15 forex strategy ideas and chart patterns, from head and shoulders to carry trades: what each one bets on, how it fails and how to test one honestly.
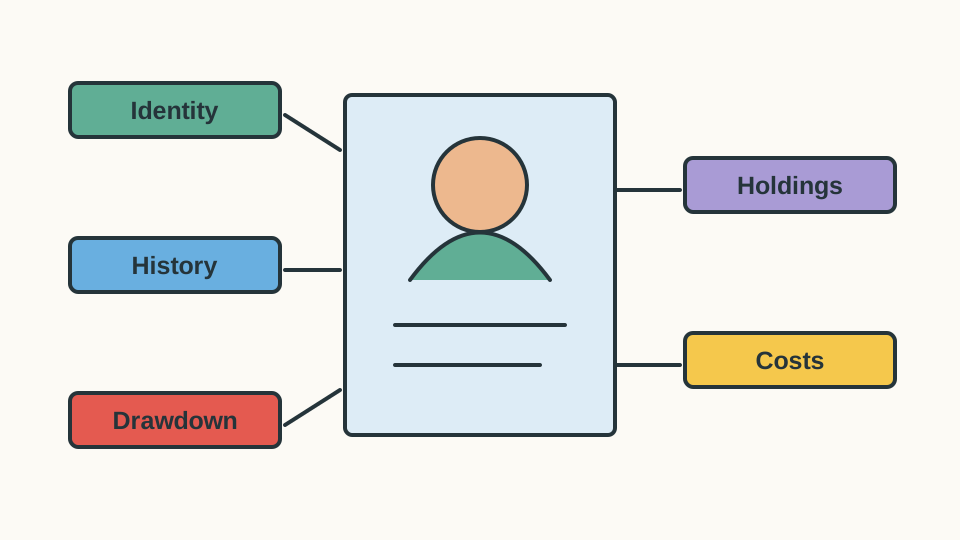
Find better eToro traders to copy in 5 steps: check the record, the deepest fall, big bets, the risk score and who gets paid, before you risk money.